A Mobile Guidebook for a Scenic Bus Route
This blog post is a write-up of my masters dissertation. I have tried to keep it as true to the original as possible, simply translating it into markdown for the web. Nevertheless, the original submission as a PDF can be viewed here which preserves the original formatting.
I decided to publish this on my blog as a) I hope it is an interesting read for some people and b) as an educational resource for others who are currently writing their dissertation and need some inspiration.
- Accompanying GitHib repository: Scenic Rides 🔗
- Original submission date: 14 August 2023
- Course: MSc Computer Science, Newcastle University
Abstract
This dissertation will discuss the development of a mobile application that acts as a guidebook for a scenic bus route. It will explore how a digital offering can be used to enhance the experience of passengers travelling on the route to bring benefits to the cultural and heritage sectors.
A background analysis of existing guidebook-style applications and research into technologies available for mobile app development was conducted to support the implementation of this project. From these research findings, an application was developed, and its implementation was discussed in detail to explain and justify the approaches taken. Finally, the application was evaluated to analyse the success of the finished product in meeting its initial aims and objectives.
Declaration
I declare that this dissertation represents my own work except where otherwise stated.
Acknowledgements
I would first like to thank my supervisor, Dr John Colquhoun, for all his advice and feedback throughout this dissertation. Secondly, Dr Daniel Nesbitt, for his leadership and teaching of the Computer Science MSc course during the year.
I would further like to thank those who volunteered to partake in the user evaluation for this project, as their feedback was highly valuable.
Finally, I’d like to pay thanks to those who contribute to open-source software which was used in this project.
Table of Contents
- Chapter 1: Introduction
- Chapter 2: Background Analysis
- Chapter 3: Application Development
- 3.1 Defining the Project Scope
- 3.2 Requirements Specification
- 3.3 User Interface Design and Application Mock-ups
- 3.4 System Architecture and UML Diagrams
- 3.5 Development Process Model and Tools
- 3.6 Project Initialisation
- 3.7 Implementation Detail
- 3.8 Application Testing Strategies
- 3.9 Development Summary
- Chapter 4: Results and Evaluation
- Chapter 5: Conclusions
- References
- Appendices
- Appendix 1: Glossary of Technical Terms and Abbreviations
- Appendix 2: Developer Documentation
- Appendix 3: Failed Test Case
- Appendix 4: Colour Blindness Test Results
- Appendix 5: User Evaluation Guide Sheet
- Appendix 6: User Evaluation Sheet for Participant 1
- Appendix 7: User Evaluation Sheet for Participant 2
- Appendix 8: Incident Report from the User Evaluation
Chapter 1: Introduction
1.1 Project Aim
The overall aim of this project is to produce a mobile application that acts as a guide for passengers travelling on a scenic bus route located in the North East of England. The application must be a guidebook that highlights forthcoming points of interest and attractions, rather than just an informational timetable app.
1.2 Objectives
The below points set out the objectives for this project which will help determine if the produced application meets the project aim.
1.2.1 Project Objectives
- Conduct a detailed background analysis of existing guidebook-style applications and material for bus routes.
- Investigate the technologies and frameworks for building mobile applications and evaluate the best technology stack for this project.
- Design the mobile application by establishing a system architecture, defining requirements, and mocking up the desired application interfaces.
- Implement the project design by acting as a software engineer to program a mobile application that delivers against the aim, objectives, and requirements.
- Evaluate the finished application by conducting testing and user evaluations to conclude if the project aim was met.
1.2.2 Personal Objectives
- Gain hands-on experience as a software engineer developing a mobile application.
- Learn a new programming language or a new subset of a programming language.
1.3 Project Description
The problem this application will aim to solve is to fill a gap in the market whereby a mobile guidebook application does not exist for scenic bus journeys. This will seek to bridge the gap between traditional media such as printed guides and a new digital offering for users.
The main motivation for completing this project is to develop an application that brings benefits to the cultural and heritage sectors. A well-designed and produced mobile app is likely to make the bus journey more attractive to potential users and consequently promote travel on the route by educating people about local attractions and points of interest. Increased route usage would ideally benefit the local economy, such as businesses, trusts, and charities along the route path. Secondly, modes of transport such as cars are damaging and polluting to the environment and a common cause of road congestion (Dubner and Levitt, 2008). Therefore, a further motivation is to reduce these negative externalities by encouraging the use of public transport.
A personal motivation for completing this project is to learn mobile application development. Understanding how native mobile apps are developed will be beneficial in terms of career and personal development by introducing a new skill set to my portfolio as a software engineer. Furthermore, completing this project will likely involve learning a new programming language and framework which will expand my knowledge.
One area which is not a motivation for this project is generating sales for bus operating companies. This means that the application is not being developed primarily to aid in increasing ticket sales for the route. Consequently, the ability to buy tickets shall not be a feature included in the project’s scope.
1.4 Project Outline and Plan
The main deliverables of this project can be broken down into two parts: a software project and a written dissertation. The software project encompasses all tasks related to programming a mobile application that meets the project’s aim. Whereas the dissertation shall cover aspects such as planning, research, a write-up of the implementation, and evaluation of results.
1.4.1 Dissertation Outline
This dissertation is set out in five distinct chapters, these are:
- Introduction: to set the overall theme, aims and objectives of the project.
- Background analysis: a discussion and analysis of the research conducted into background material relevant to the theme of the project.
- Application development: a discussion of the tasks carried out during this software project and the reasons behind their implementation.
- Evaluation: a detailed look at the project results and evaluation of the implementation and approaches taken.
- Conclusion: a summary of how well the project met its initial aims and objectives, as well as a discussion for further expansions.
Additionally, this dissertation contains supporting material such as references and appendices attached at the end. A glossary of technical terminology and abbreviations used has been included in Appendix 1.
1.4.2 Project Plan
Figure 1 is a Gantt chart which sets out a preliminary timeline for the project, detailing how time will be split between tasks. The vertical axis represents tasks, and the horizontal axis represents week-commencing dates.
Figure 1: Gantt chart of the project timeline.

Chapter 2: Background Analysis
The background analysis will aim to conduct research into two main areas. Firstly, research into the existing solutions built around the theme of bus routes and secondly research into the technologies available to develop a mobile application.
2.1 Analysis of Existing Applications
Initial findings show that existing applications which target the precise aim of this project either do not exist or are not publicly available. As a result, research in this area will attempt to find similar applications. The aim of this is to understand what does and does not work well in current applications to aid decision-making surrounding which features would be beneficial to include in this project’s scope and requirements.
To conduct a fair and consistent evaluation of each application, a framework established by Olsina et al. (2008) will be used. While this framework was originally designed for e-commerce web applications, its top-level evaluation categories as outlined in Figure 2 can be applied more universally.
Figure 2: Application assessment criteria, adapted from Olsina et al. (2008, p. 408).
- Usability
- Understandability – such as appropriate labelling and ease to recognise labels/icons.
- Learnability – ease of use for first-time visitors.
- Operability – stability and steady behaviour of controls.
- Attractiveness – colour, uniformity, and aesthetic perception.
- Functionality
- Function Suitability – the capability to perform actions from user interaction.
- Function Accuracy – precision of result from user interactions.
- Content
- Information Suitability – both basic and contextual information is provided.
- Content Accessibility – readability of content.
- Reliability
- Non-deficiency (Maturity) – free from defects and errors.
Throughout each of the following evaluations, applications will be judged against these top-level categories and criteria to analyse their strengths and weaknesses.
2.1.1 Scenic Buses
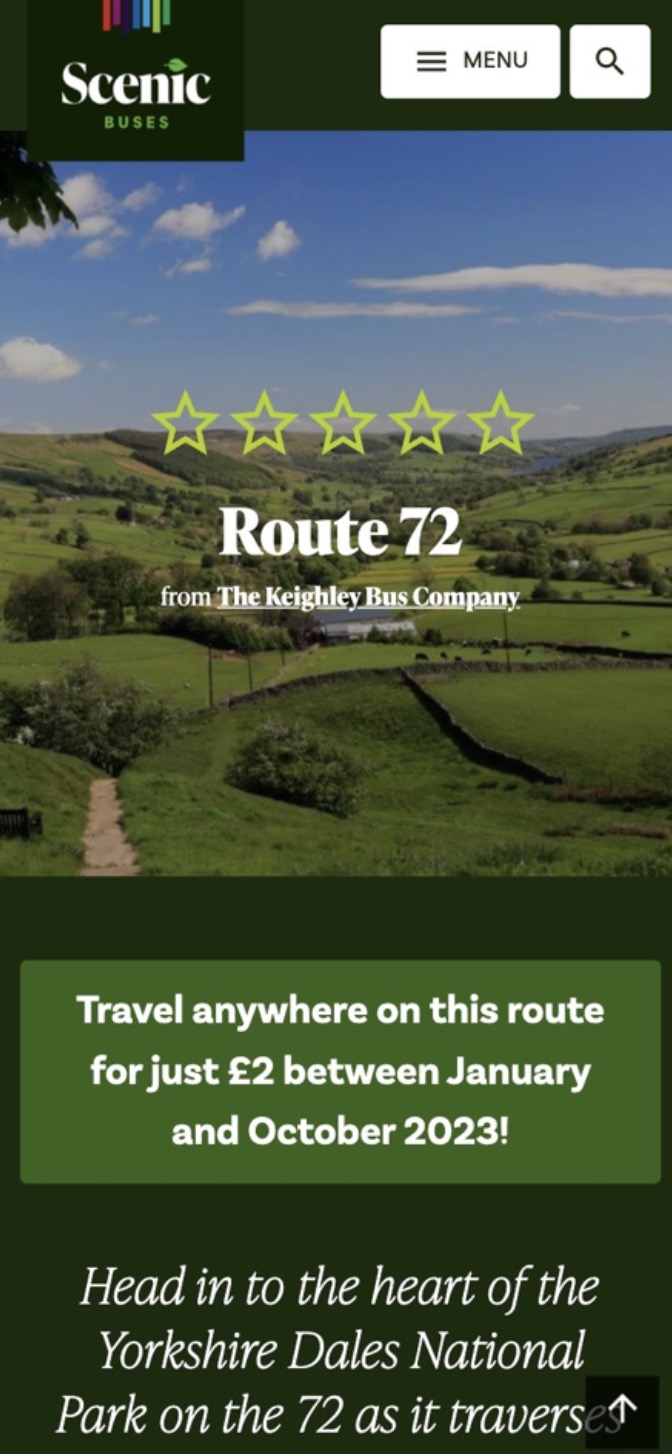
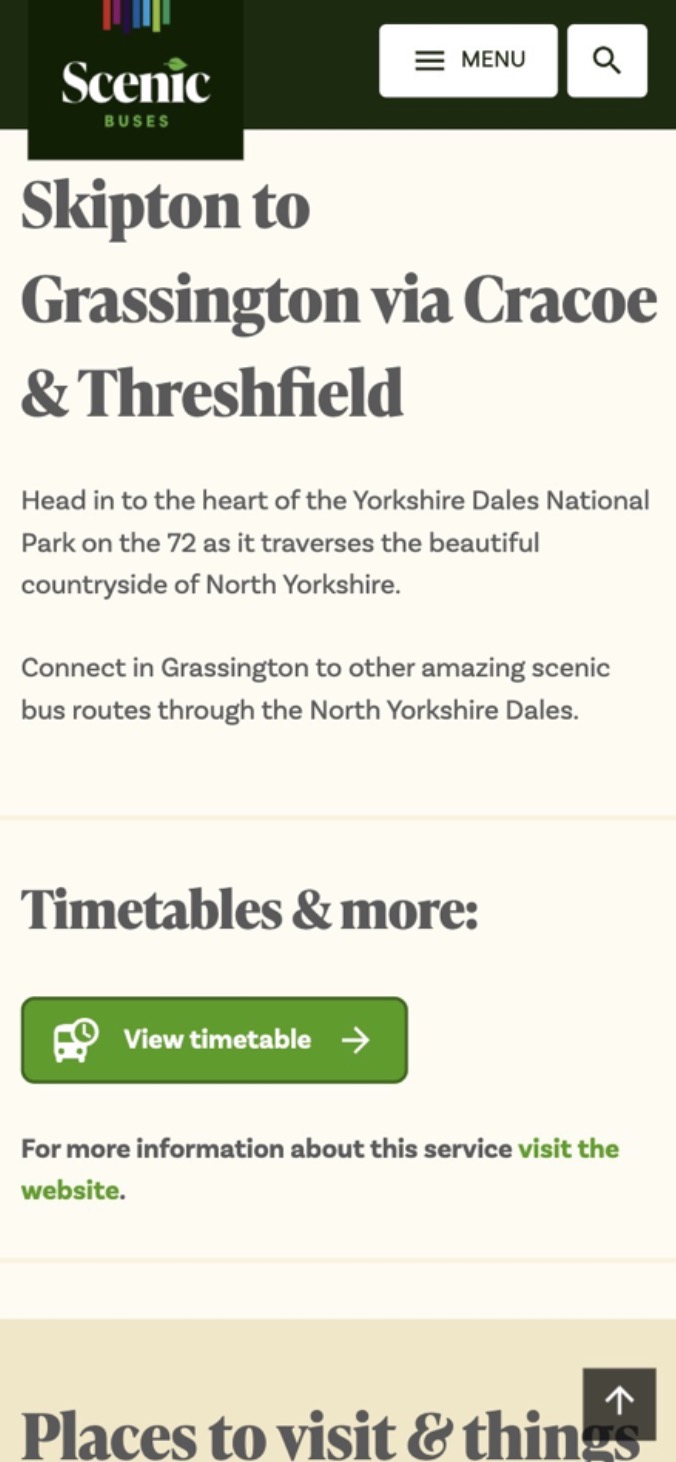
Scenicbuses.uk is a publicly available website “that showcases the many fantastic scenic bus routes available in the UK” (Scenic Buses, 2022). This site is a web-based application that is available across both desktop and mobile platforms. However, as the focus of this project is mobile based, this evaluation will focus on the site’s mobile experience. Screen captures are provided in Figures 3 – 7 to provide a visual representation of the website.
Figures 3 & 4: Screenshots of the Scenic Buses website.
Figures 3 & 4 are screen captures of scenicbuses.uk index and routes pages taken 19 June 2023.
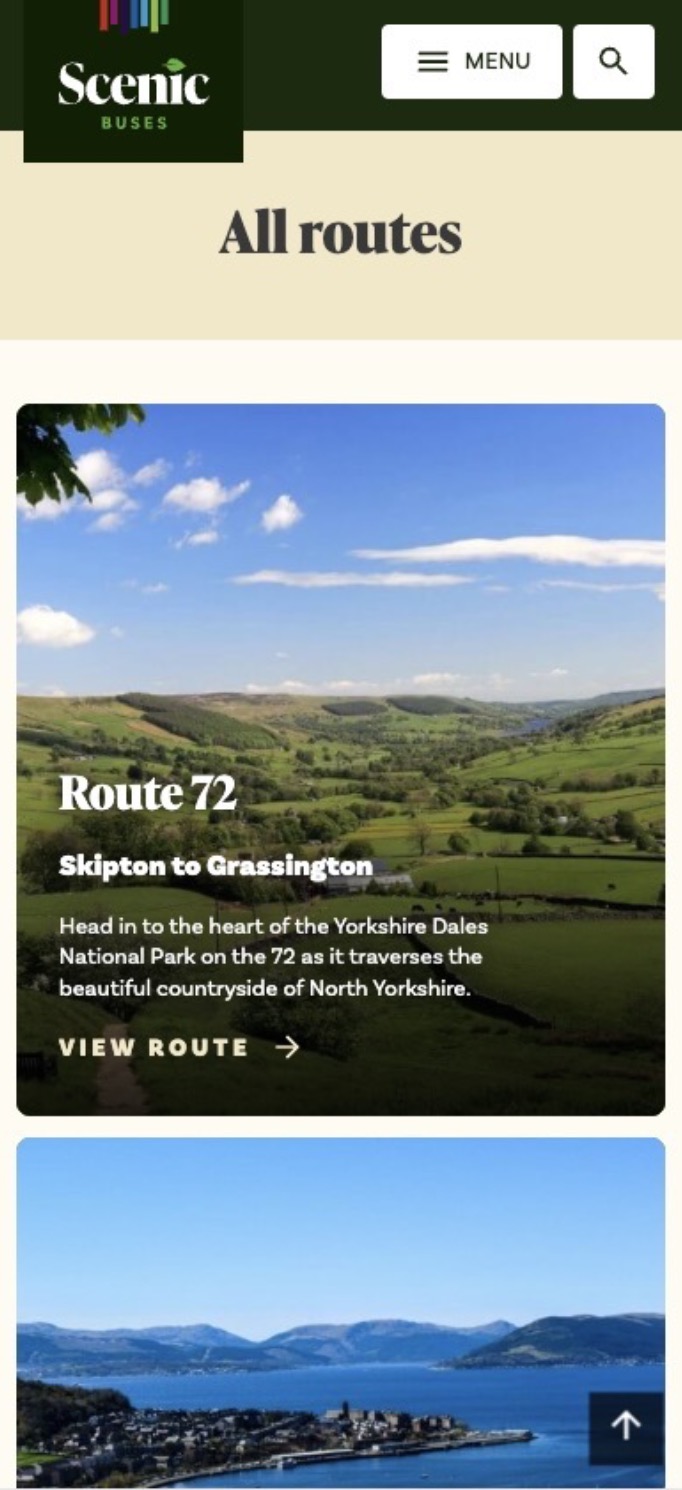
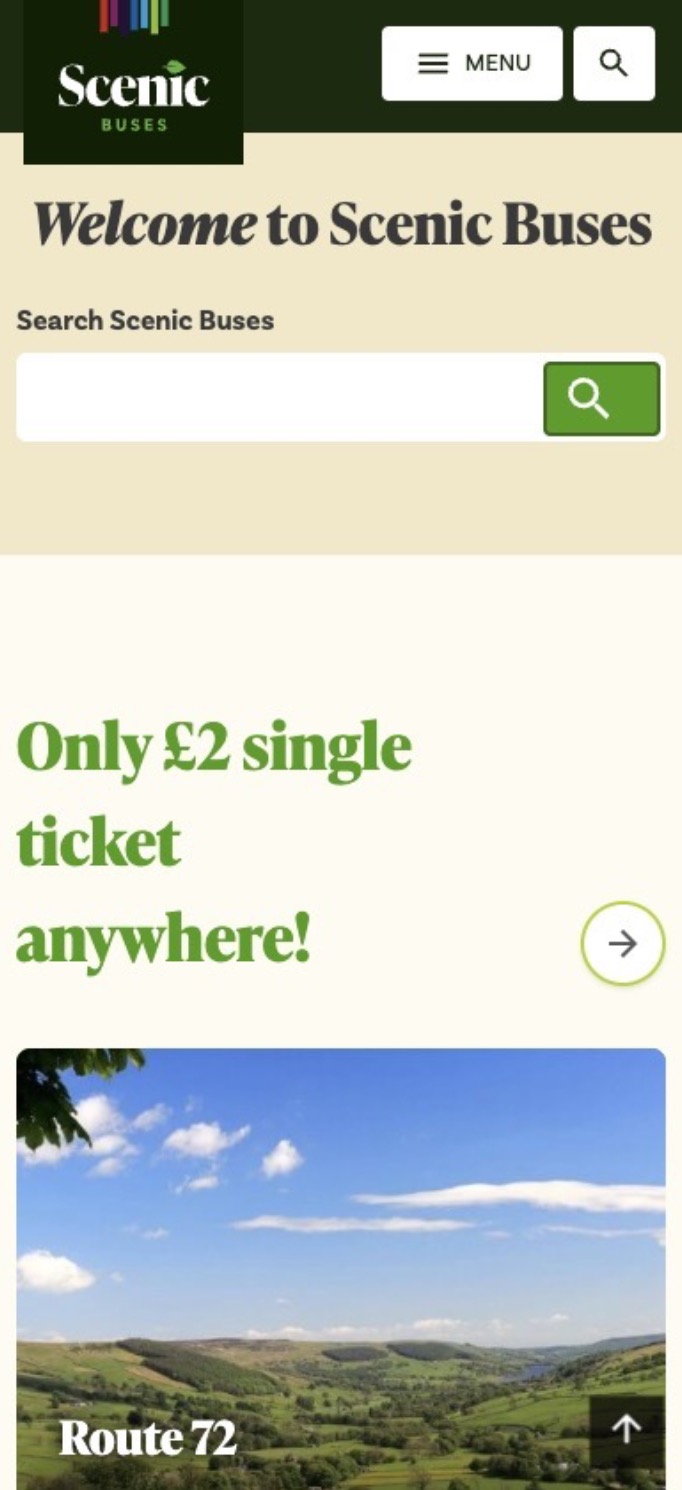
Figures 5, 6 & 7: Screenshots of the Scenic Buses website.
Figures 5 – 7 picture screenshots of scenicbuses.uk website illustrating a page dedicated to Route 72 taken 19 June 2023.

From an understandability (1.1) and learnability (1.2) perspective, this site implements clear and easy-to-use icons and descriptive navigational elements. Regarding operability (1.3), infrequent visual bugs such as misaligned buttons were noted, however, the functionality of those elements is not affected. The overall aesthetics (1.4) of the site is a strong point. The site is rich with media such as photos and visual content, additionally, the green colour scheme highlights the scenic setting.
The main functionality (2.0) and interaction provided by the application is internal and external linking to resources and pages. Throughout testing, no issues were identified with broken links. The search functionality of the website was accurate at providing results when searching by either location or route.
The content provided is suitable (3.1) for the topic of scenic buses. It provides the necessary basic information about each route such as the name, general timetable, photos, and a brief description of the route. Some links feel misleading or lacking. For example, exploring the “Places to visit & things to do along the way” section simply links to more bus routes. Although the user may wish to travel on more bus journeys, extra places to visit like attractions and points of interest would add value to these pages. Additionally, the content standard varies across the site between thin pages versus those with insightful long-form information. The content accessibility (3.2) delivers mixed results. Many of the images on the site do not provide alt text, but the plain text accessibility is good.
Additional factors to consider in this evaluation is that Scenic Buses is not run officially by the bus operating companies, but rather as a non-profit by an individual (Scenic Buses, 2022). This means the routes and content of the site could potentially contain inaccuracy where the data provided does not reflect the source, i.e., a bus timetable being out of date. A second factor to consider is that the site is marketed to be promotional for the routes. It specifically lists itself as a tool for companies to “reach a whole new market of people with ease and for free” (Scenic Buses, n.d.). It is important to consider these factors when evaluating the application as it is probable that they influence the design and content that has been produced.
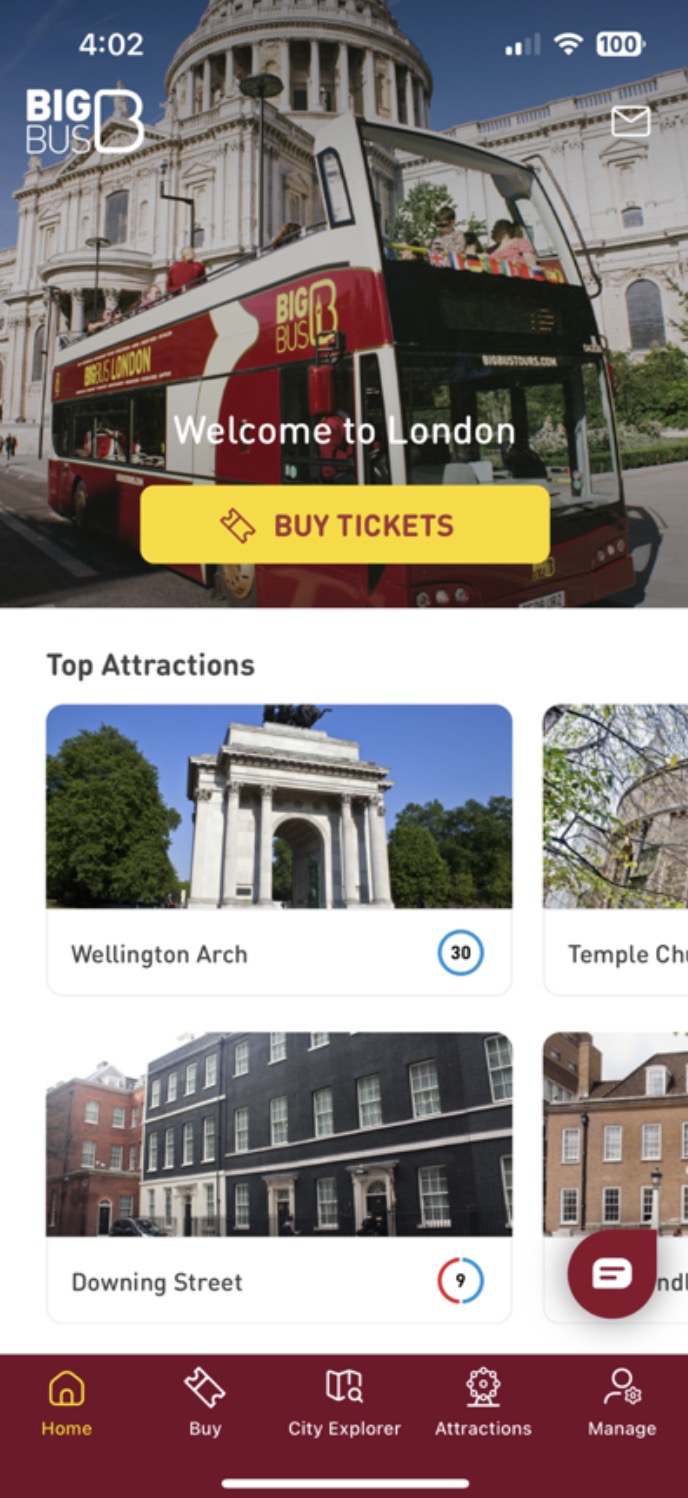
2.1.2 Big Bus Tours Mobile Application
Big Bus Tours is an international sightseeing tour company, operating open-top buses in 24 cities around the world (Big Bus Tours, 2023). In comparison to this project, Big Bus Tours focuses on cities instead of rural scenic destinations. For this evaluation, the application was set up to view London bus routes.
Big Bus Tours (2023) states the purpose of their mobile application is to “help you make the most of your Big Bus Tour” by providing “detailed route maps, stop locations and pictures, and browse nearby attractions and landmarks.” Despite the difference in destination types, this application is highly comparable to the overall aim of this project in that it acts as a follow-along guide for passengers on the route. Its features such as real-time tracking enable users to see their location to nearby attractions. One feature of the Big Bus Tours application this evaluation will not focus on is the ability to buy tickets within the app, as this has already been discussed as being out-of-scope.
Figure 8: Screenshot of Big Bus Tours application launch screen.
Figure 8 pictures Big Bus Tours (2023) iOS mobile app launch screen taken 24 June 2023.
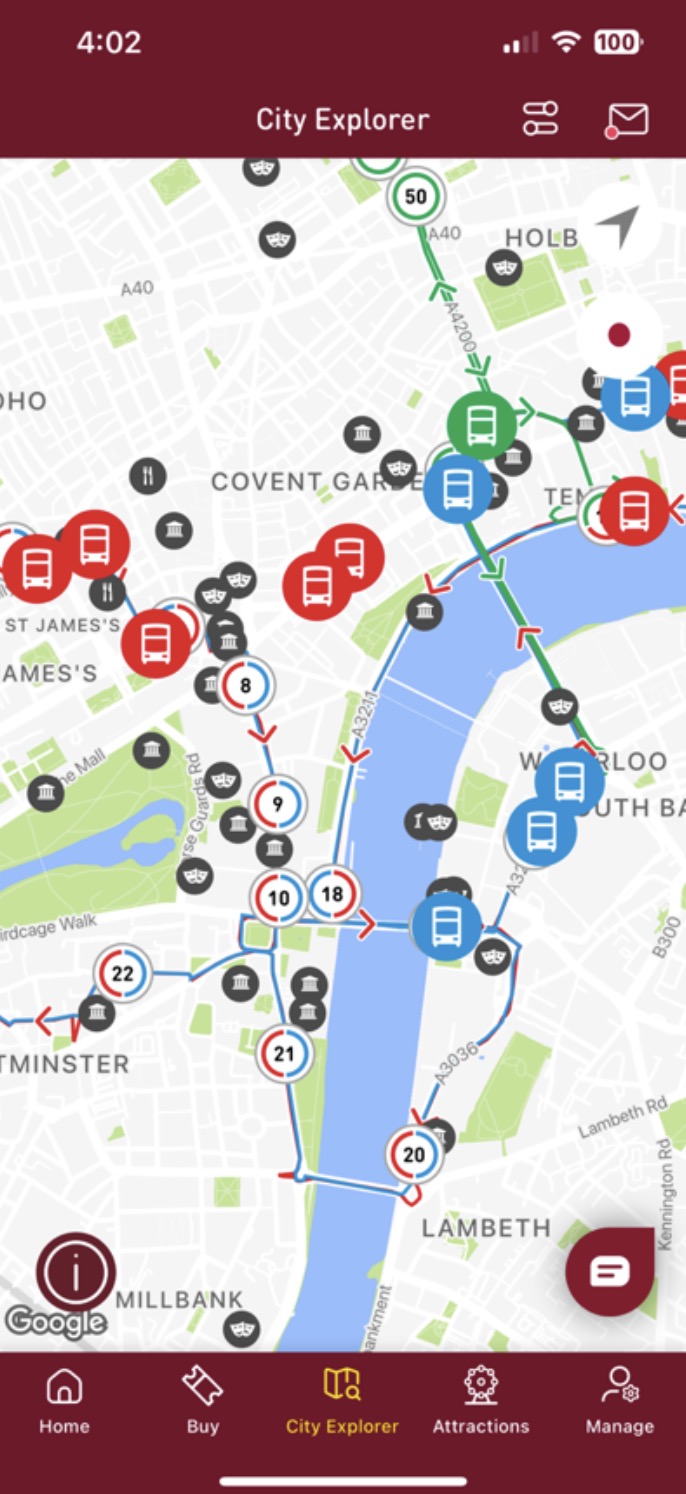
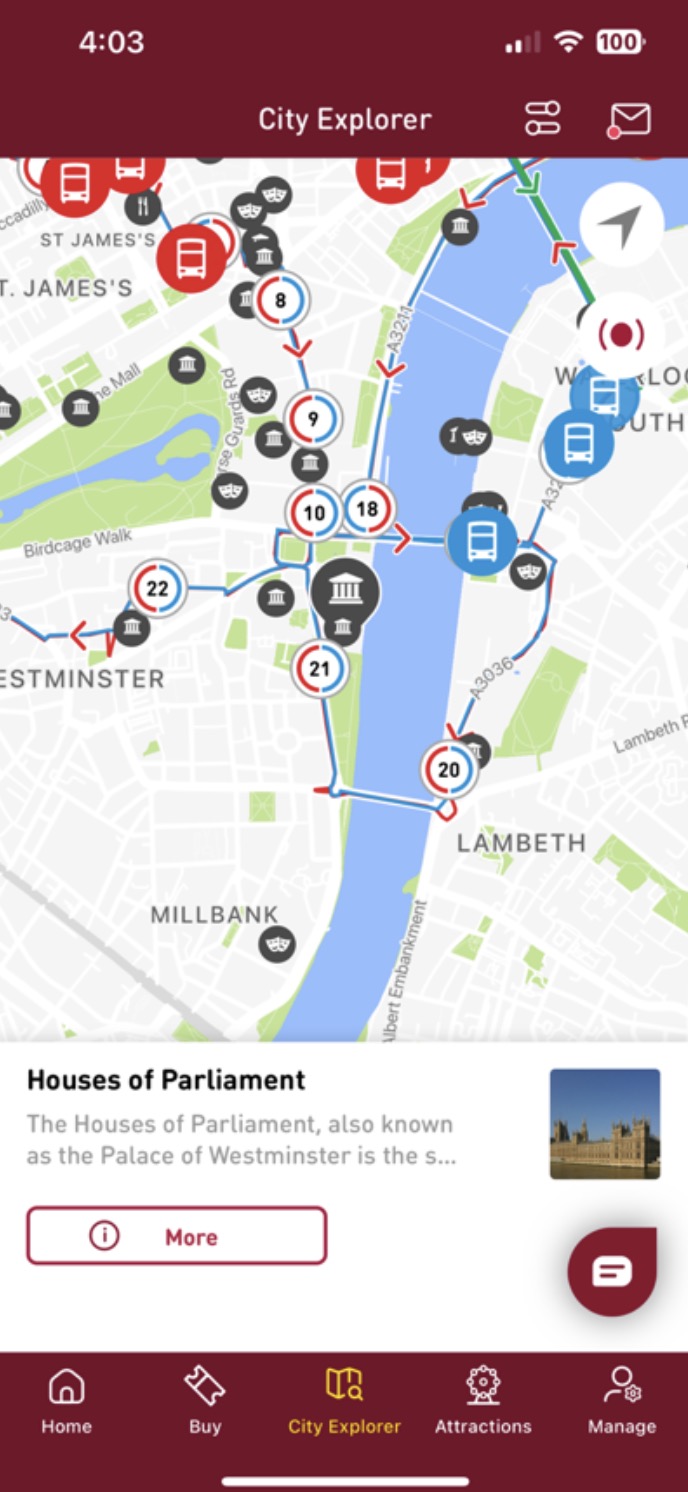
Figures 9, 10 & 11: Screenshots of Big Bus Tours map screens.
These figures illustrate the map views of Big Bus Tours (2023) app taken 24 June 2023.
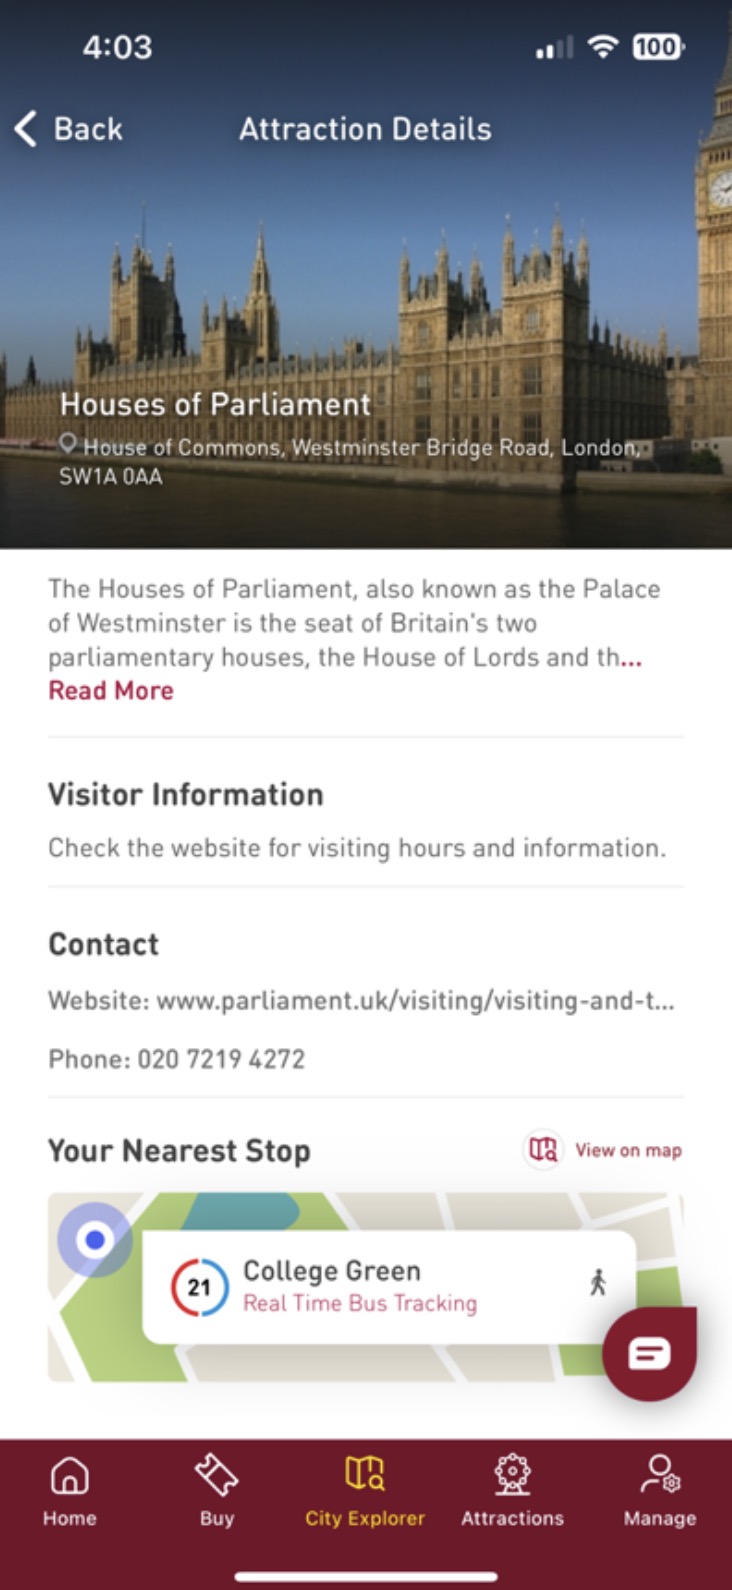
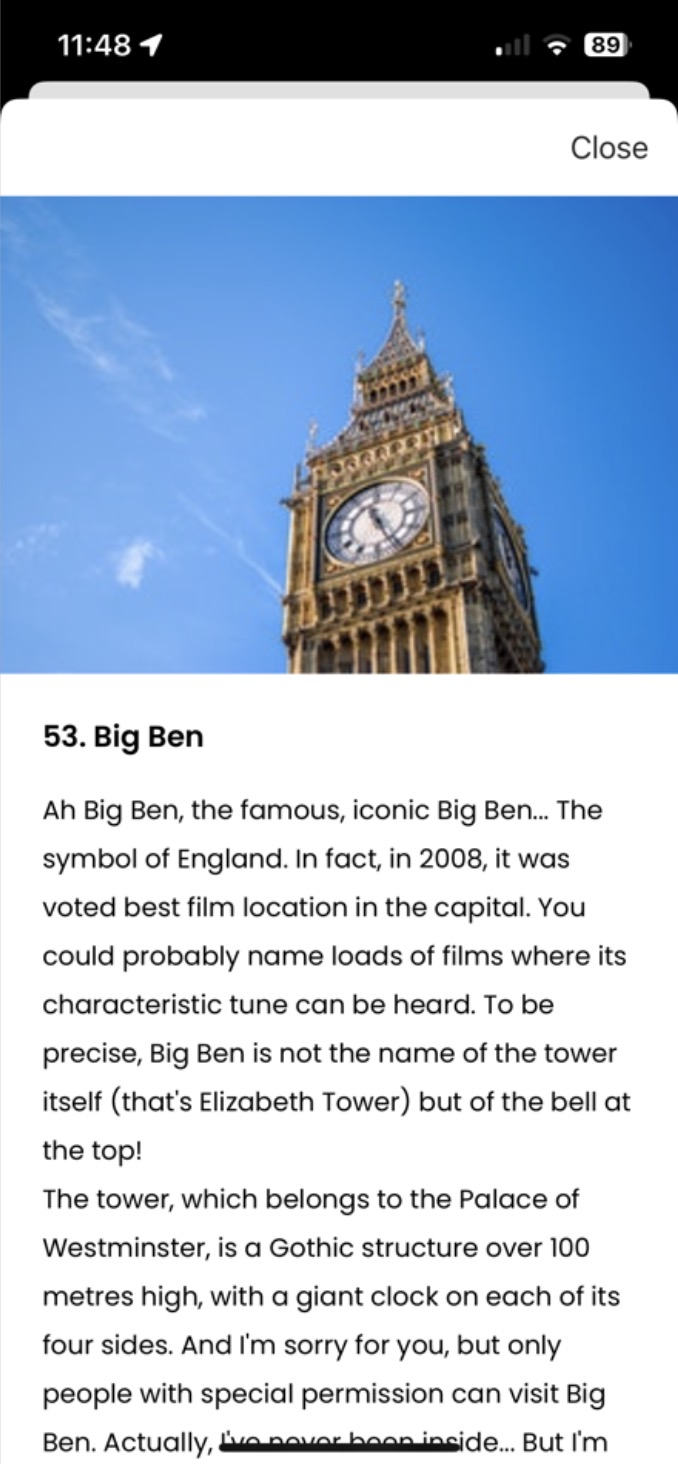
Figures 12 & 13: Screenshots of Big Bus Tours attraction screens.
Figures 12 & 13 picture the attractions list and an example attractions page of the Big Bus Tours (2023) application taken 24 June 2023.
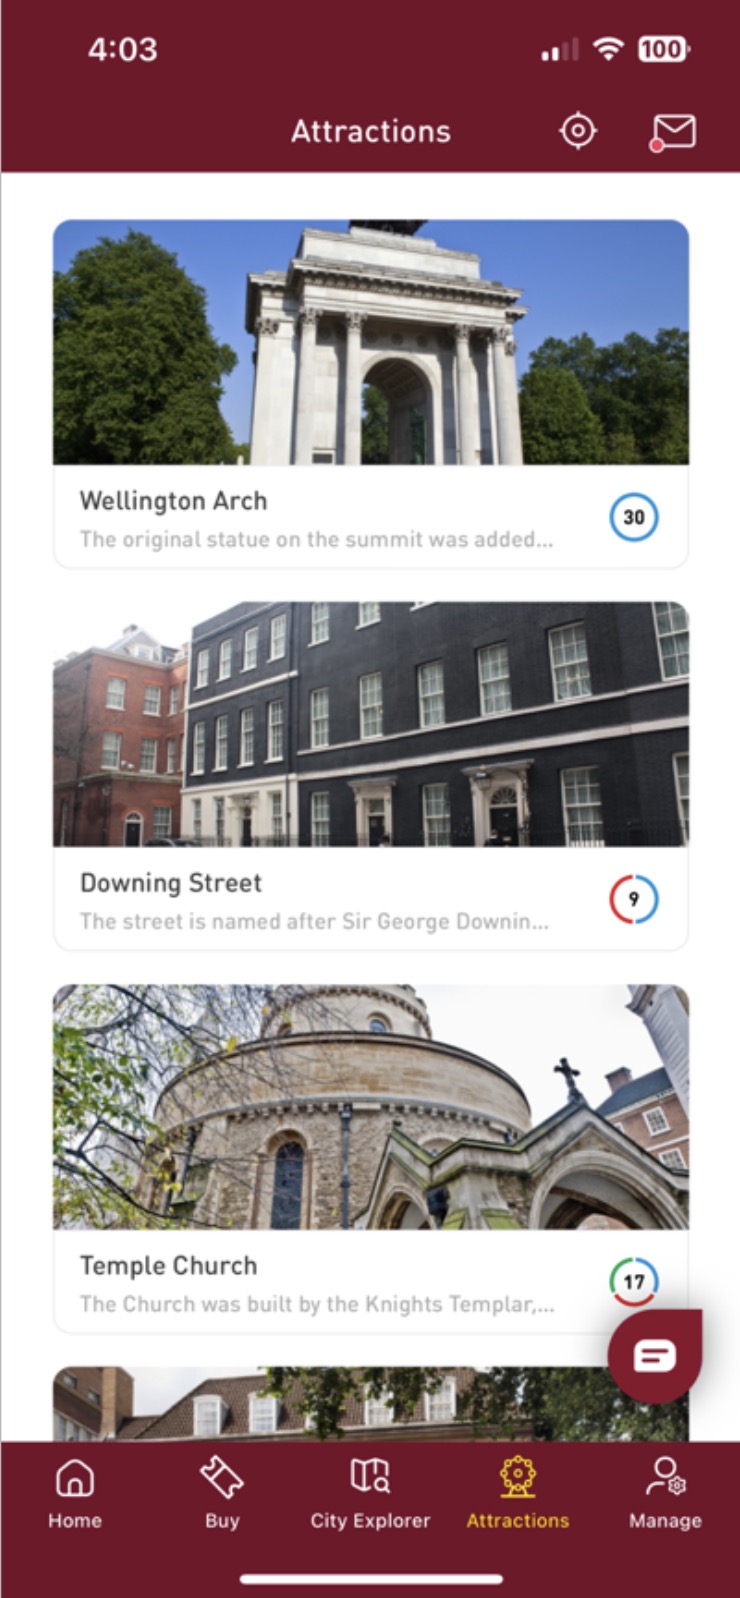
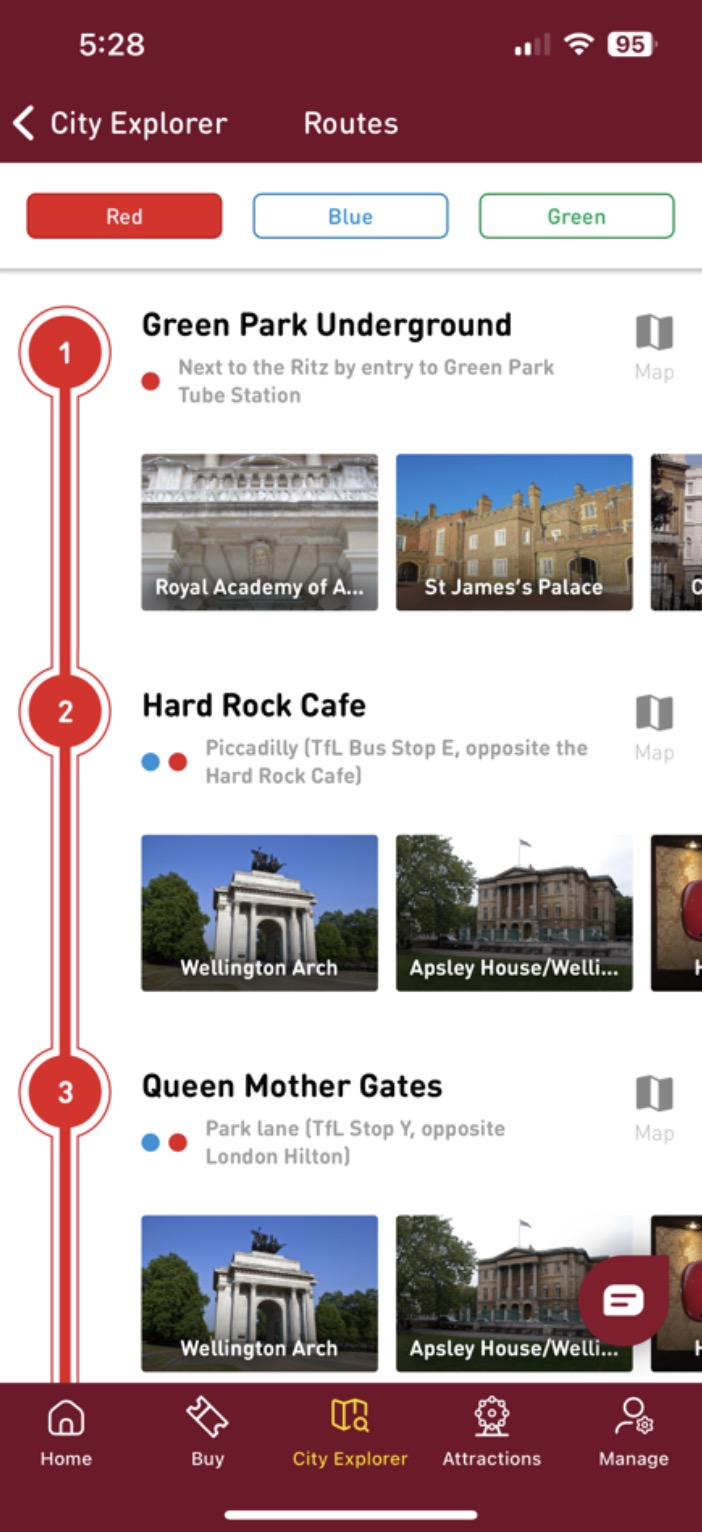
Evaluating the application in terms of understandability (1.1), the application overall is well- labelled with recognisable icons for buttons. Some icons such as the numbers surrounded in blue and red circles next to each stop are not immediately obvious that these relate to the coloured routes and stop numbers. This reduces the app’s learnability (1.2) for new users; however, their use case becomes clearer once interacting with the app. The app utilises the iconic burgundy-red colour scheme of its brand to achieve attractiveness (1.4).
One downside from a usability perspective is that the application at times felt cluttered. Specifically, the map view in Figures 9 & 10 features many small icons which are overlayed on each other. Therefore, the operability (1.3) was reduced by this issue, although the remaining application operated as expected. One feature of the application which felt highly usable and suitable for a vertical mobile screen is a timeline-style component as seen in Figure 14 below. This set out the route from first to last stop highlighting attractions at each.
Figure 14: Screenshot of Big Bus Tours timeline screen.
Figure 14 illustrates the red route timeline of the Big Bus Tours (2023) app taken 24 June 2023.
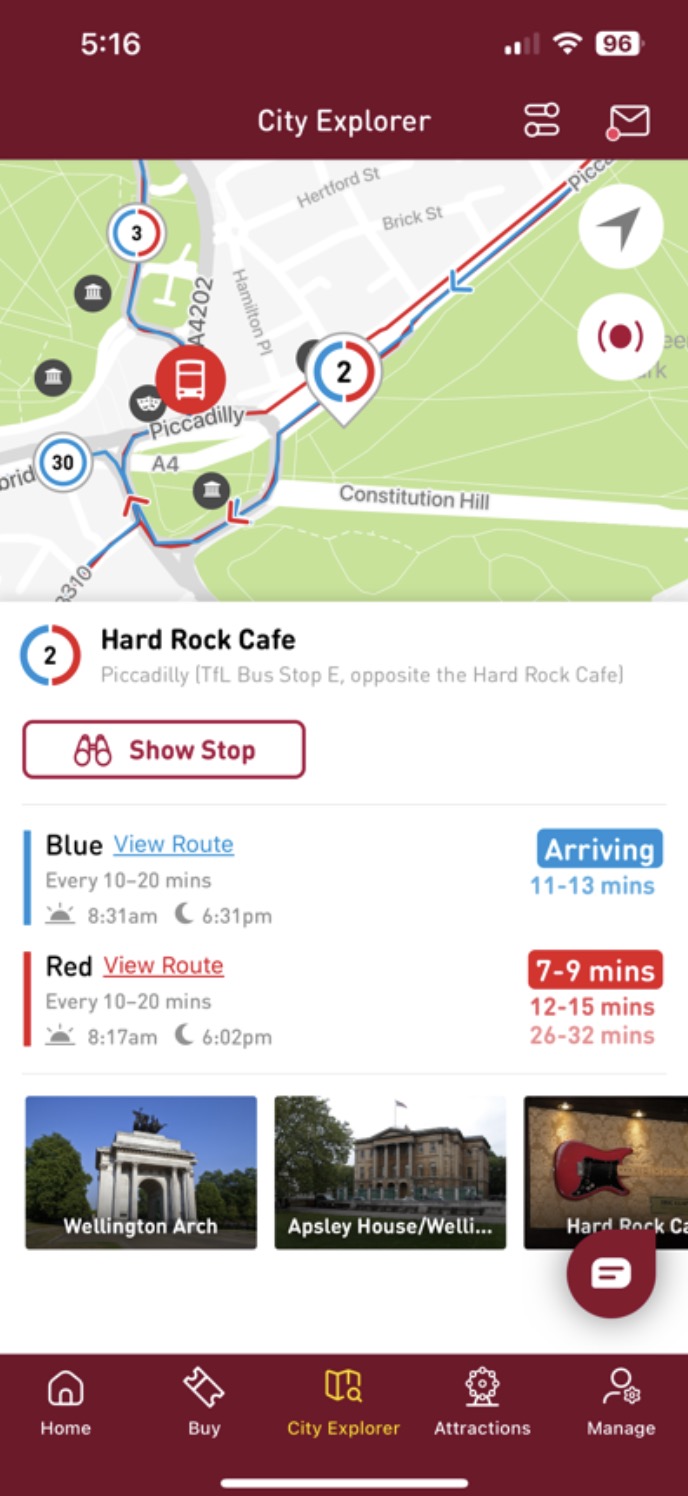
The suitability and accuracy of the application functions (2.1 & 2.2) were satisfactory. Unfortunately, the map screen’s real-time updates on bus locations were often minutes out of sync. Moreover, after observing the map for some time a defect (4.1) was found wherein buses teleported several miles across London, further highlighting inaccuracies in the tracking functionality. Outside of these issues, no further problems with functionality were found in testing.
The suitability of information (3.1) was strong for this application, with it utilising a variety of mediums such as text, images, and map components. The information on attractions felt well thought through, providing basic details, interesting facts, visitor information, contacts, and more. Accessibility (3.2) could have been improved on some elements (as depicted in Figures 12 & 13) whereby a light grey text was used on a white background which could result in readability issues for some users. Furthermore, the map icons seen in Figure 9 were relatively small until zoomed in, which could be difficult to use for people with coordination problems.
2.1.3 Toot Bus City Guide Application
Tootbus (n.d.) are a tour company that describes itself as a way to visit “iconic cities” as they “guide you on your journey.” Their mobile application (Tootbus, 2023) acts similarly to that of Big Bus Tours as a guidebook and tracking application for their city tour buses. Therefore, although the application is again focused on cities, the aim of the application is similar to that of our project. London was selected as the city to conduct this evaluation around and the below figures illustrate the application screens.
Figure 15: Screenshot of Tootbus mobile application landing screen.
Figure 15 pictures the Tootbus (2023) iOS mobile application landing screen taken 27 June 2023.
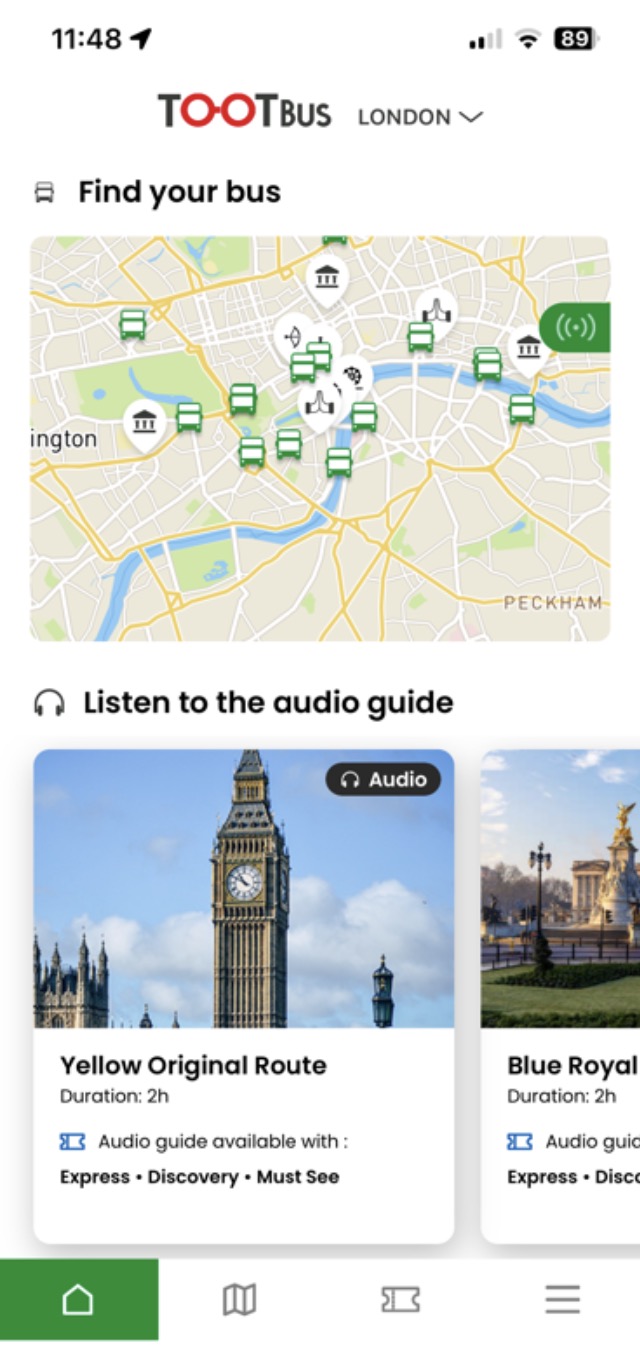
Figures 16, 17 & 18: Screenshots of Tootbus’s map and timeline screens.
Figures 16 & 17 illustrate the Tootbus (2023) applications map screen and Figure 18 pictures the timeline of the yellow route taken 27 June 2023.
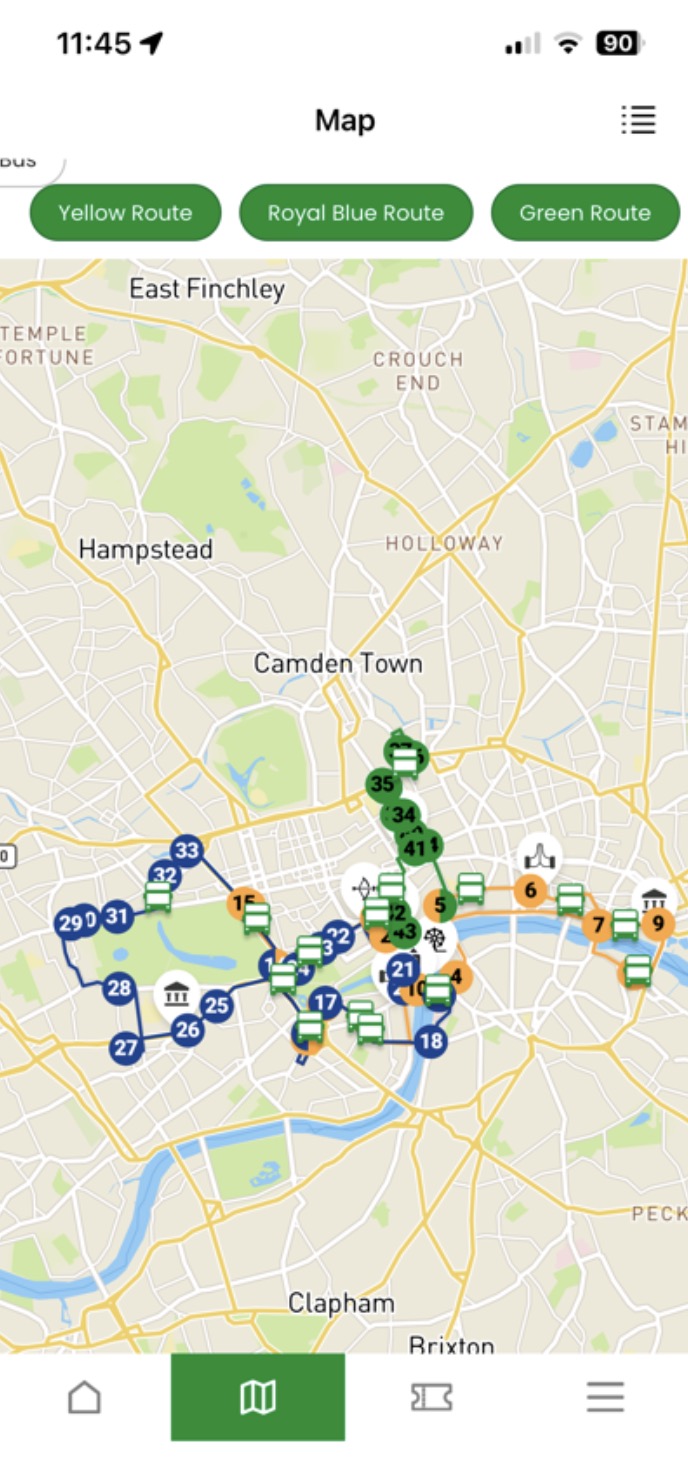
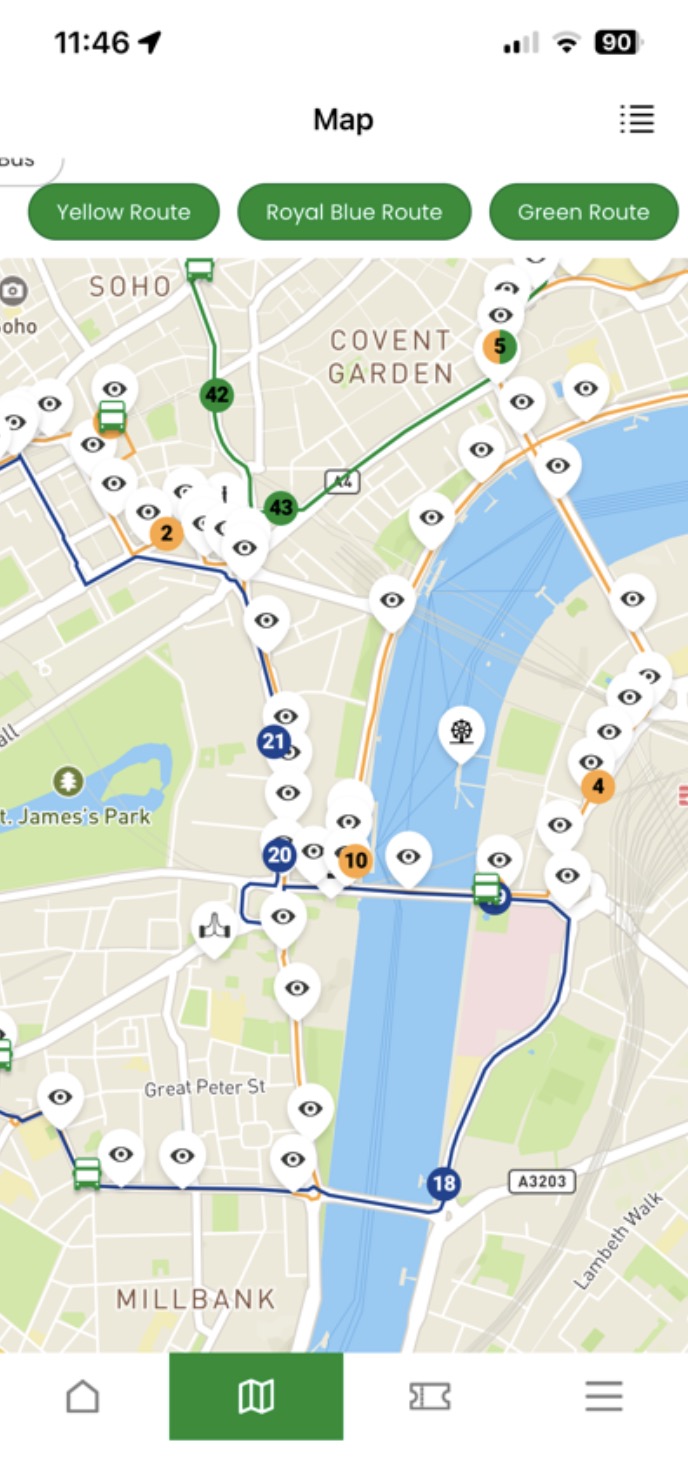
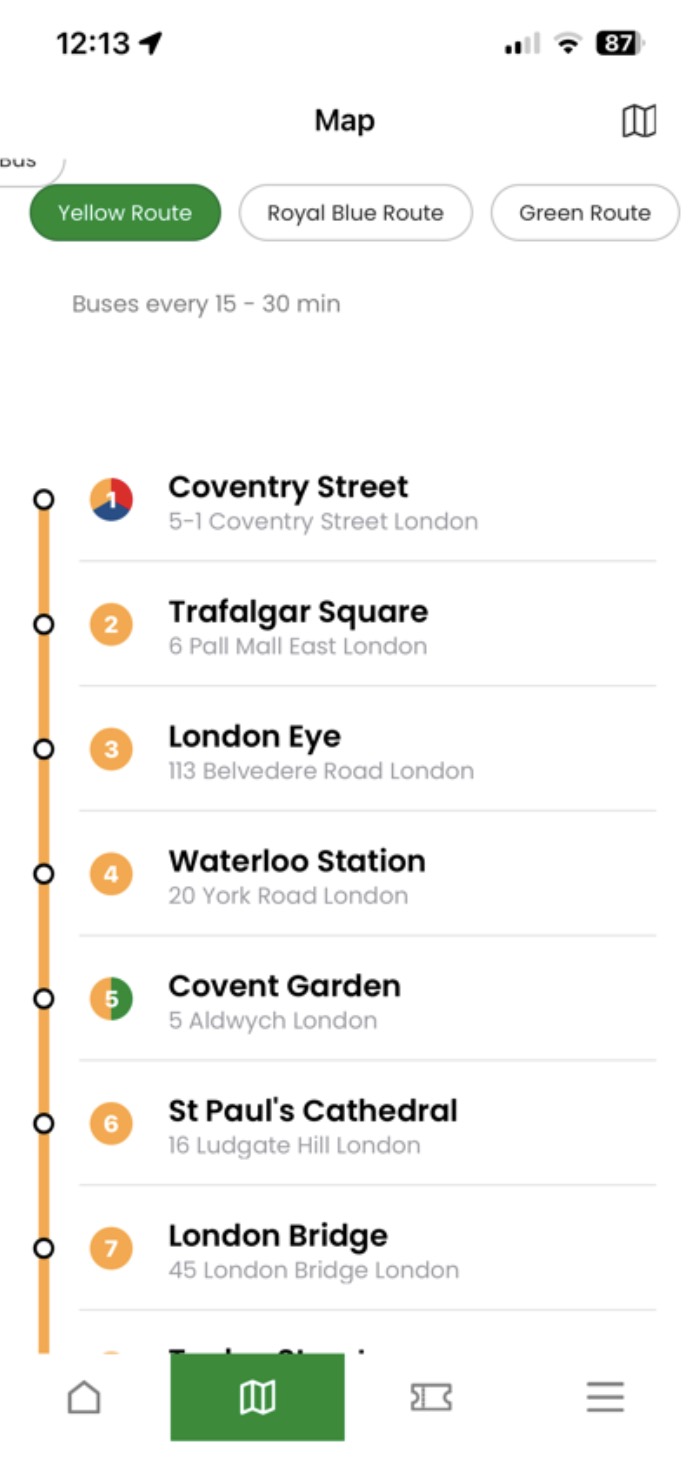
Figure 19: Screenshot of Tootbus route screen.
Figure 19 pictures Tootbus (2023) mobile application yellow route screen taken 27 June 2023.
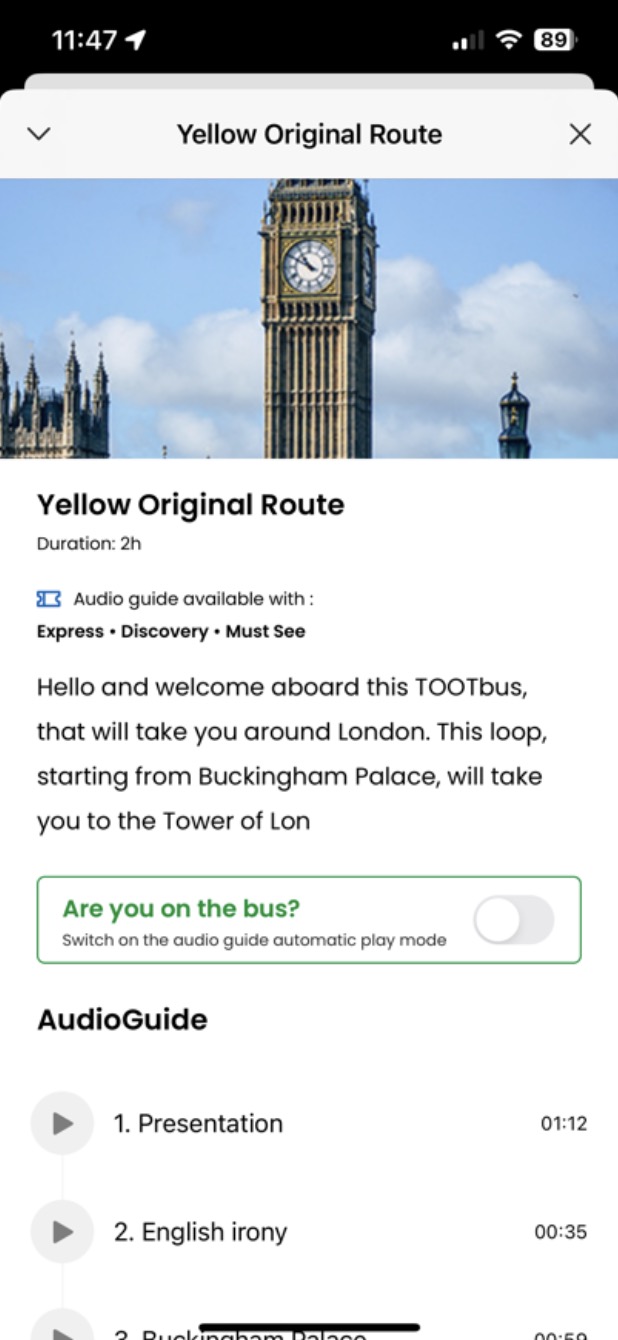
Figures 20 & 21: Screenshots of Tootbus attraction screens.
Figures 20 & 21 illustrate screens of Tootbus (2023) applications tourist attraction screens taken 27 June 2023.

Overall the application’s understandability (1.1) was adequate. The application used a wide variety of recognisable icons to represent common functions and navigational links. One criticism which harmed the application’s understandability is that different icons were used for the same task. For example, this is noticeable in Figure 19 where both a cross and a down arrow were presented to close a modal. Additionally, in Figures 20 & 21 this task is replaced with the wording “Close.” This lack of consistency negatively impacts the application’s understandability and creates an inconsistent user journey.
This application implements similar features to Big Bus Tours (2023) that negatively impact its usability. Figure 18 illustrates the same style icons to represent coloured routes with stop numbers, which impacts learnability (1.2) as their use case is not immediately obvious to new users. Similarly, sections of the application feel cluttered to use and inoperable (1.3). This is mainly caused by the map view which feels impractical with too many icons grouped together (Figure 16). This can be resolved in part through zooming in as seen in Figure 17. The presentation (1.4) is overall plain due to the high usage of white backgrounds and menus. A little colour is added using a green call to action.
On the whole, the functionality (2.0) works as intended, with only minimal inaccuracies (2.2) and defects (4.1) being uncovered in testing. One example, as seen in Figures 16 – 18 is a cut-off button in the top left corner, coupled with a partially cut-off map icon in the right corner in Figure 18. Some functionalities of the app from a user experience perspective feel missing. For example, the stop timeline seen in Figure 18 feels like it should click through to find out more about each stop. Despite this being an option on the map view, the list view does not support it. Furthermore, some functionality seems unsuitable. Clicking to view a specific route as seen in Figure 19 automatically commences the download of 117 audio clips for that route. This feature creates unnecessary network usage with no opt-out as it is the default behaviour when navigating to the page.
The content provided in the application (3.1) does not appear as well developed or maintained as the previous two applications reviewed. There was a variety of mediums including text, visual and audio content for some attractions and routes. However, a large proportion of attractions simply show a blank white screen such as Figure 21. This is unacceptable from a user perspective, as the screen to view content should not be available if none exists, consequently leading to a bad user experience. The accessibility of content (3.2) was very good due to most of the application using black text on a white background making it clear to read. The inclusion of audio clips could be considered beneficial for those with visual impairments.
2.1.4 Summary of Results
The evaluation of these existing applications has aided in understanding which features do and do not work well in guidebook-style applications. Overall, the main insights gained from this research include:
- Including a variety of content of different mediums and ensuring thin content pages (or pages without content) are not presented to users. Content should aim to match the user’s intent of visiting the page.
- Designing a consistent user interface (UI) that implements recognisable icons, is easy to use, and accessible to all.
- Taking caution not to overwhelm the user with too much content on a single page that it loses meaning or becomes harder to understand or function.
The application to be developed for this project will aim to build upon this insight and avoid implementing mistakes noticed throughout this evaluation of existing applications.
2.2 Research of Bus Routes
An appropriate route will need to be identified for this application to be developed around. To ensure the route is suitable, a minimum criterion it must fulfil is set out below. Failure of the chosen route to meet these conditions could lead to future problems, such as having too few attractions to make the route viable or being too inaccessible for further research and user testing.
Route criteria:
- The route should be classed as scenic, so to meet the overall project aim.
- The route must be within travelling distance to access. In this case, travelling distance is classed as within reach of public transport from Newcastle upon Tyne.
- The route should have a minimum of 7, but ideally 10 to 15 points of interest. This ensures adequate content can be produced for the application.
Two initial routes were identified, which are the X18 Arriva service between Newcastle upon Tyne and Berwick upon Tweed (Arriva, n.d.), and the AD122 Go North East between Hexham and Haltwhistle (Go North East, n.d.).
2.2.1 X18 Arriva
The X18 route was the most accessible given that it departed from Newcastle city centre, thus meaning minimal travel would be required to reach the start. However, Arriva’s (n.d.) official webpage for the route does not list any further details except a timetable. Other sources have listed this route as one of England’s most scenic that visits destinations such as Dunstanburgh and Alnwick Castle, Holy Island, Lindisfarne Nature Reserve, and more (Taplin, 2023; Northumberland Coast AONB, 2020, pp. 38-40).
2.2.2 AD122 Go North East
The AD122 runs a shorter route than the X18 between Hexham and Haltwhistle. Despite not passing through Newcastle directly, it is still accessible via bus and train from Newcastle city centre, thus meeting this requirement. Go North East (n.d.) lists the route as an opportunity to see “some of the country’s most spectacular landscapes” and “explore our Roman heritage.” It runs along the path of Hadrian’s Wall and passes attractions such as Chesters Roman Fort, Vindolanda, the Roman Army Museum, and Walltown Crags.
2.2.3 Evaluation of Available Routes
Both routes investigated met the minimum criteria and therefore would be viable to build the application around. Furthermore, each route runs on a regular schedule, increasing their accessibility to use in person for further research and testing. One difference between the routes is that the X18 is significantly longer in distance versus the AD122. However, this should not impact the ability of the application to meet its objectives and therefore is an irrelevant ranking factor.
From the research conducted above, the AD122 route was much better documented in terms of route details and content on attractions which made it easy to gather information from trusted official sources. Whereas, finding details on the X18 route required a more thorough investigation to get basic information. As a result, the AD122 is the most desirable route for developing this application around, as it meets all basic requirements and has plentiful existing content to expand off.
2.3 Mobile Application Development Technologies and Platforms
Mobile application development is defined by Amazon Web Services (2023) as creating software that runs on a mobile device, typically on one of the two dominant operating systems, iOS from Apple or Android from Google. Software engineers can achieve this by using software development kits (SDKs) and toolchains provided by Apple and Google to create installable mobile apps (bundles) for the target device. The scope of this research will be constrained to only iOS and Android mobile systems to focus efforts on software that is mass adopted, rather than covering every edge case of mobile development.
2.3.1 Programming Languages and Frameworks
Randhawa (2022) details the options for developing mobile applications to be the Java (Oracle, n.d.) or Kotlin (JetBrains, n.d.) languages for Android and Objective-C (Apple, 2014) or Swift (Swift, n.d.) for iOS. These languages are designed to interact directly with the device’s hardware through interfaces and APIs. As each operating system is designed separately by Google and Apple there is no guarantee of backwards compatibility to support applications developed for a different platform. McWherter and Gowell (2012) note that the differences in system architecture prevent apps from being portable between systems, require special development environments and tooling, and must still be designed to suit a wide variety of different device specifications. This can result in a very fragmented environment for those wishing to develop a mobile app.
In more recent years, Randhawa (2022) discusses that cross-platform development options such as React Native (n.d.) and Flutter (n.d.) have become increasingly popular choices. These frameworks provide a workaround to the problems stated above by compiling a single code base to native Android and iOS binaries.
2.3.2 Evaluation of Available Technologies and Platforms
As discussed above, the options for mobile development each come with their own advantages and trade-offs. Wasserman (2010, p. 400) notes this gives mobile application developers several options:
- develop for a single platform and miss market share.
- develop native applications for each platform paying a higher cost for development.
- use mobile web applications to remove native code bases.
- utilise layers of abstractions to create a “write once” native executable.
The benefits and drawbacks of each approach are highly complex topics in themselves. Amazon Web Services (2023) summarise the high-level pros and cons of these approaches under categories such as performance, cost of development, the complexity of codebase, and access to native device features. Table 1 details Amazon Web Services (2023) evaluation in more depth.
Table 1: Benefits and Drawbacks of Mobile Development Approaches, adapted from Amazon Web Services (2023).
| Native Applications | Cross-Platform Applications | Hybrid-Web Applications |
|---|---|---|
| Pros | ||
| Best runtime performance | Single code base for multiple platforms | Shared code base between web and mobile apps |
| Direct access to device APIs | Easy to build and maintain your app | Using web development skill-set for building mobile apps |
| Cons | ||
| Higher costs when building and maintaining your app | Dependent on bridge and libraries for native device features | Lower performance compared to native apps |
| Multiple code bases for each platform | Performance limitations due to bridging | Limited support for native device features |
To definitively say which approach is best overall would be difficult and most likely inconclusive, as the best approach will depend on the context of the application being developed and who is developing it. For example, a large multinational company requiring a high-performance application may benefit more from having two native codebases for iOS and Android. Whereas, for a local business with a limited budget, a hybrid-web application may be the better choice. However, there are plenty of examples whereby some of the world’s largest companies and most used applications utilise cross-platform or even web-based approaches. Such as Facebook, Microsoft, and Pinterest using React Native or Google and eBay using Flutter (React Native, n.d.; Flutter, n.d.). Concerning this project, a mobile guidebook for a scenic bus route, the following factors have been considered in evaluating the options available as detailed below.
- Performance: it is not anticipated the application will require a native-only code base to be performant.
- Device APIs: some device APIs and interfaces may need to be accessed (geolocation and device storage), both a native and cross-platform approach supports these.
- Cost and complexity: the project must be delivered for free (due to its educational background) and within a tight timescale (2.5 months from start to finish). Therefore, measures should be taken to reduce complexity.
- Availability: ideally the finished application should not limit a major share of the market from using the app. Therefore, availability should extend to both Android and iOS.
Based on these factors, the mobile development approach considered most suitable is a cross- platform solution utilising React Native. The React Native framework triumphed over Flutter, the alternate cross-platform option, as the skill set required for React is highly transferable to and from web development. This makes React a strong choice for developers already familiar with JavaScript (ECMAScript, 2023) and the web ecosystems. Whereas Flutter’s use of the Dart programming language (Dart, n.d.) makes it harder to adopt. This approach will ensure an application compatible with both iOS and Android can be delivered with a single code base written in JavaScript.
2.4 Mobile Technologies Specific to a Scenic Bus Application
This section of research will aim to investigate and evaluate the suitability of specific technology solutions which are likely to be implemented in this application.
2.4.1 Mapping Technologies
Mapping technologies refer to platforms that enable application developers to embed a visual map representing the real world in terms of geography, street names, and satellite imagery into an application. Some examples of popular map solutions include the Google Maps Platform (n.d.), Apple Maps (Apple, n.d.), and OpenStreetMap (n.d.). These technologies work by sending network requests through an API or SDK interface to download a series of tiles which represent the physical world map. These tiles are centred around a longitude and latitude coordinate location and stitched together when rendered to the user’s screen (Google Maps Platform, 2023).
Adnan and Khan’s (2010) usability evaluation list some potential advantages of maps such as being intuitive for users to use and learn, providing a user interface to display wide geographical regions, and providing directions to nearby places. Furthermore, the study notes maps are particularly helpful in tourism as they play “an important role in providing information to the visitors and tourists” (Adnan and Khan, 2010, p. 17). Such benefits are transferable to the context of an application for a scenic bus route and therefore build a strong case for embedding maps in the application to be built.
However, in a rural setting, one issue that may hinder this implementation is mobile signal coverage. This is because mapping technologies work by sending network requests to download the necessary tiles from an online server. Adnan and Khan (2010) discuss this limitation in their study as requiring high bandwidth to transfer the required data, thus slow internet causes high response times and user frustration. Consequently, the implementation detail should look at ways of minimising this issue such as offline maps, caching map tiles, or static map solutions.
2.4.2 Geolocation
Mozilla (2023a) describe geolocating as retrieving a user’s location within an application, for example, to plot their location on a map or display personalised information. The World Geodetic System (WGS84) is a worldwide accepted standard for geolocating objects through standardised measures such as coordinates (longitude and latitude), altitude and heading that can be accessed through various device interfaces (World Wide Web Consortium, 2023; GISGeography, 2022).
Geolocation can be implemented in this project to understand where the user is positioned in relation to nearby bus stops, attractions, and the overall route. This data can be used to show users relevant information in the app relative to their position. For example, what is the closest stop and attraction to the user?
One consideration that is important when using geolocation features is user privacy. W3C (2023) outlines geolocating as requiring “express permission” which requires users to grant the application the ability to use a “powerful feature.” Correspondingly, the application to be produced should adhere to these standards. Additionally, the implementation should consider fallback options to ensure functionality does not break should a user deny access to their geolocation.
2.4.3 Data and Assets Storage
The production of this application will require some form of storage for the application data and assets. Data might include information about the route and attractions, whereas assets are in reference to media used within the application such as images. There are multiple ways to achieve this from having an external backend API which hosts the data and images to on-device storage such as SQLite (n.d.). A backend API which serves this data is likely an undesirable solution as it leads to the same problem discussed earlier in section 2.4.1 regarding mobile network coverage. If the signal quality is poor, the client may be unable to download the data and images for the application to display.
Expo, a toolchain for React Native, discusses a solution to this issue in their documentation whereby React Native applications can bundle assets and data into their standalone binary which ships with the application (Expo, n.d.; Expo, 2022). This has the benefit of allowing for a mobile application to work offline without reliance on network usage, which will be advantageous in a rural setting. One downside to this approach is that changes to the application data/assets would require a new version of the application to be published and downloaded. However, as the data in question is not highly dynamic (e.g., changing frequently by the hour or day) this downside is of less significance.
2.5 Summary of Background Research
To summarise the findings of Chapter 2, the background analysis conducted has identified and evaluated several applications for bus routes. This evaluation has uncovered positive and negative points of each application which will be learned from and built upon in this project.
Furthermore, the investigation of bus routes determined that the AD122 is the most suitable for this application. This is due to its scenic path through Northumberland, easy access from Newcastle upon Tyne, and plentiful points of interest.
Finally, the research into technologies available for mobile application development has concluded that React Native is the most suitable framework enabling an iOS and Android application to be produced using JavaScript. Further findings on mapping technologies, geolocation, and offline build tools will help inform decisions made during the development process.
Chapter 3: Application Development
This chapter contains a detailed discussion of the approaches taken to implement this project. It aims to describe and explain each stage of the development process to give a high-level overview of the software engineering principles and procedures that were applied.
3.1 Defining the Project Scope
The below points define the project scope based on the aims and objectives established in Chapter 1, together with the knowledge and findings gained from the background analysis in Chapter 2. This aims to assert at a top level what will and will not be implemented.
3.1.1 Features In-scope
- The development of a mobile application that acts as a guidebook for a scenic bus route.
- The application will only be developed around one bus route, the AD122.
- Whilst only developed around one route, the architecture and design of the application should make it so additional routes can be added without significant re-engineering.
- The application should be iOS and Android compatible and built with React Native.
- The inclusion of features and specifications which are detailed in the functional and non-functional requirements of section 3.2.
3.1.2 Features Out-of-scope
- The ability for users to purchase tickets for the route.
- Real-time bus timetabling or bus location tracking. Whilst the application should use the user’s geolocation, it will not use tracking devices on buses themselves.
- The development of a backend system for the mobile application. The application should work as a standalone app without reliance on an external system.
- The development will focus on smartphone devices (a max screen width of 500 logical pixels). Tablets, which can be classed as mobile devices, will not be considered in the user interface design.
3.2 Requirements Specification
The functional and non-functional requirements describe what and how the application will work. Each is given a priority from high to low based on their deemed importance to the project achieving its overall aims and objectives.
Table 2: Functional requirements.
- FR1 - The application should have a home screen showing and linking to the available bus route(s) and linking to an about and help screen (High priority).
- FR2 - The application will have a screen for each bus route integrated into the app. This will contain a link to the route guide and a short details section (High).
- FR3 - The application will have a guide screen for each bus route giving an overview of the whole route (High).
- FR4 - The guide screen should show the relevant attractions and stops along the route in sequential order (start to finish) (High).
- FR5 - The guide screen should use the device’s geolocation to show the user’s position in relation to nearby stops or attractions (High).
- FR6 - The application must seek user permission to use geolocation features (High).
- FR7 - The guide screen should function as expected regardless of the direction of travel (referred to as “Inbound” and “Outbound”) and geolocation permission (High).
- FR8 - The guide screen will show a picture and name for each attraction (High).
- FR9 - The application will have an attraction screen for each attraction/point of interest on the route (High).
- FR10 - Each attraction screen will contain images and details about the attraction. Details might include a brief description, opening times, nearest bus stop, etc (High).
- FR11 - Text, images, maps, and other media or resources will be credited and linked to in the application so users can read more from the source (High).
- FR12 - Each bus stop will have a brief description detailing what is available nearby to the stop (Medium).
- FR13 - The application should function as expected for users not on the bus physically, i.e., if a user uses the app at a bus stop on the route, nearby attractions will show as expected (Medium).
- FR14 - The application will use mapping technologies to display a visual map to the user (Medium).
- FR15 - The application will alert users of upcoming attractions through push notifications (Low).
- FR16 - Users can add attractions along the route to a favourites list (Low).
Table 3: Non-functional requirements.
- NFR1 - The application shall be developed in React Native to support iOS and Android platforms (High).
- NFR2 - The application should be architectured to support more than one route (even if only initially developed for the AD122 in this project) (High).
- NFR3 - The geolocation accuracy must locate users at a minimum to the closest bus stop or attraction (High).
- NFR4 - The application will compile its data and assets into its binary to minimise network usage (High).
- NFR5 - The application will use a dataset of coordinate points which represent the longitude and latitude of bus stops and attractions on the route (High).
- NFR6 - When the user loads the guidebook screen, it should geolocation them and update the user interface within 2 seconds (Medium).
- NFR7 - Should an error occur, the application should communicate the issue in a clear and concise message (free from error codes or stack traces) and allow for recovery such as giving constructive advice to resolve the error or navigation away should the error be non-resolvable (Medium).
3.3 User Interface Design and Application Mock-ups
3.3.1 Initial Sketches
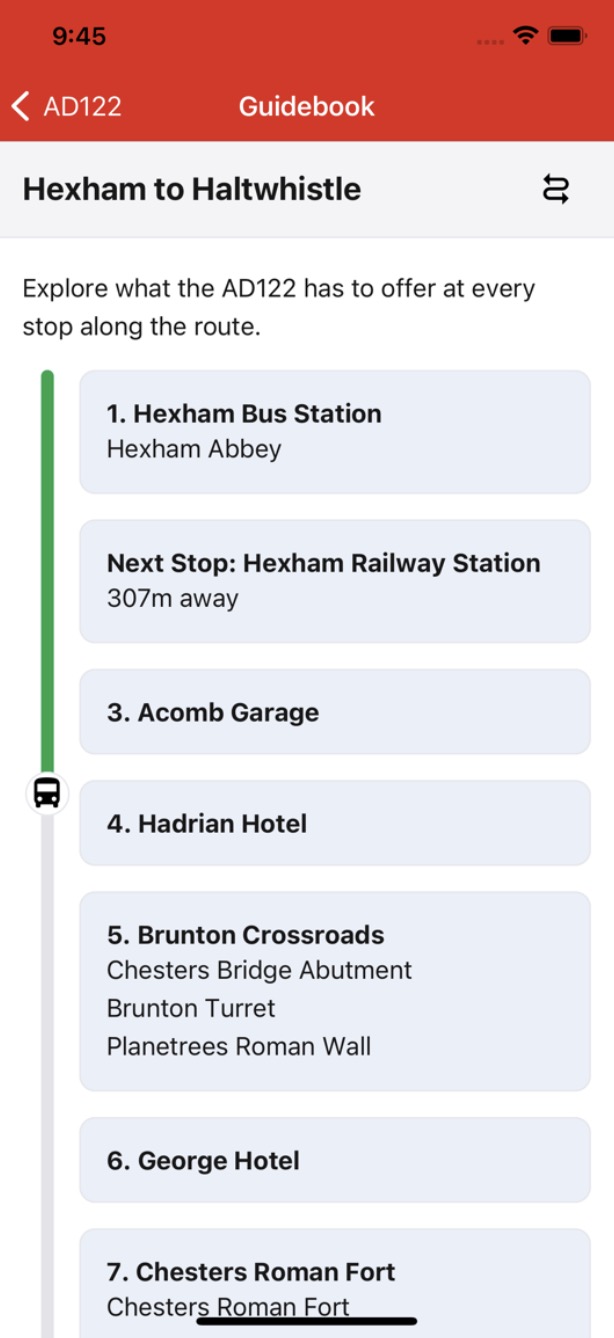
The first set of visual mock-ups produced for the application were pen and paper sketches illustrating the layout of each of the application’s screens. These aimed to create a skeleton of each of the app’s on-screen elements as pictured in Figure 22.
Figure 22: Initial sketches of the app screens.
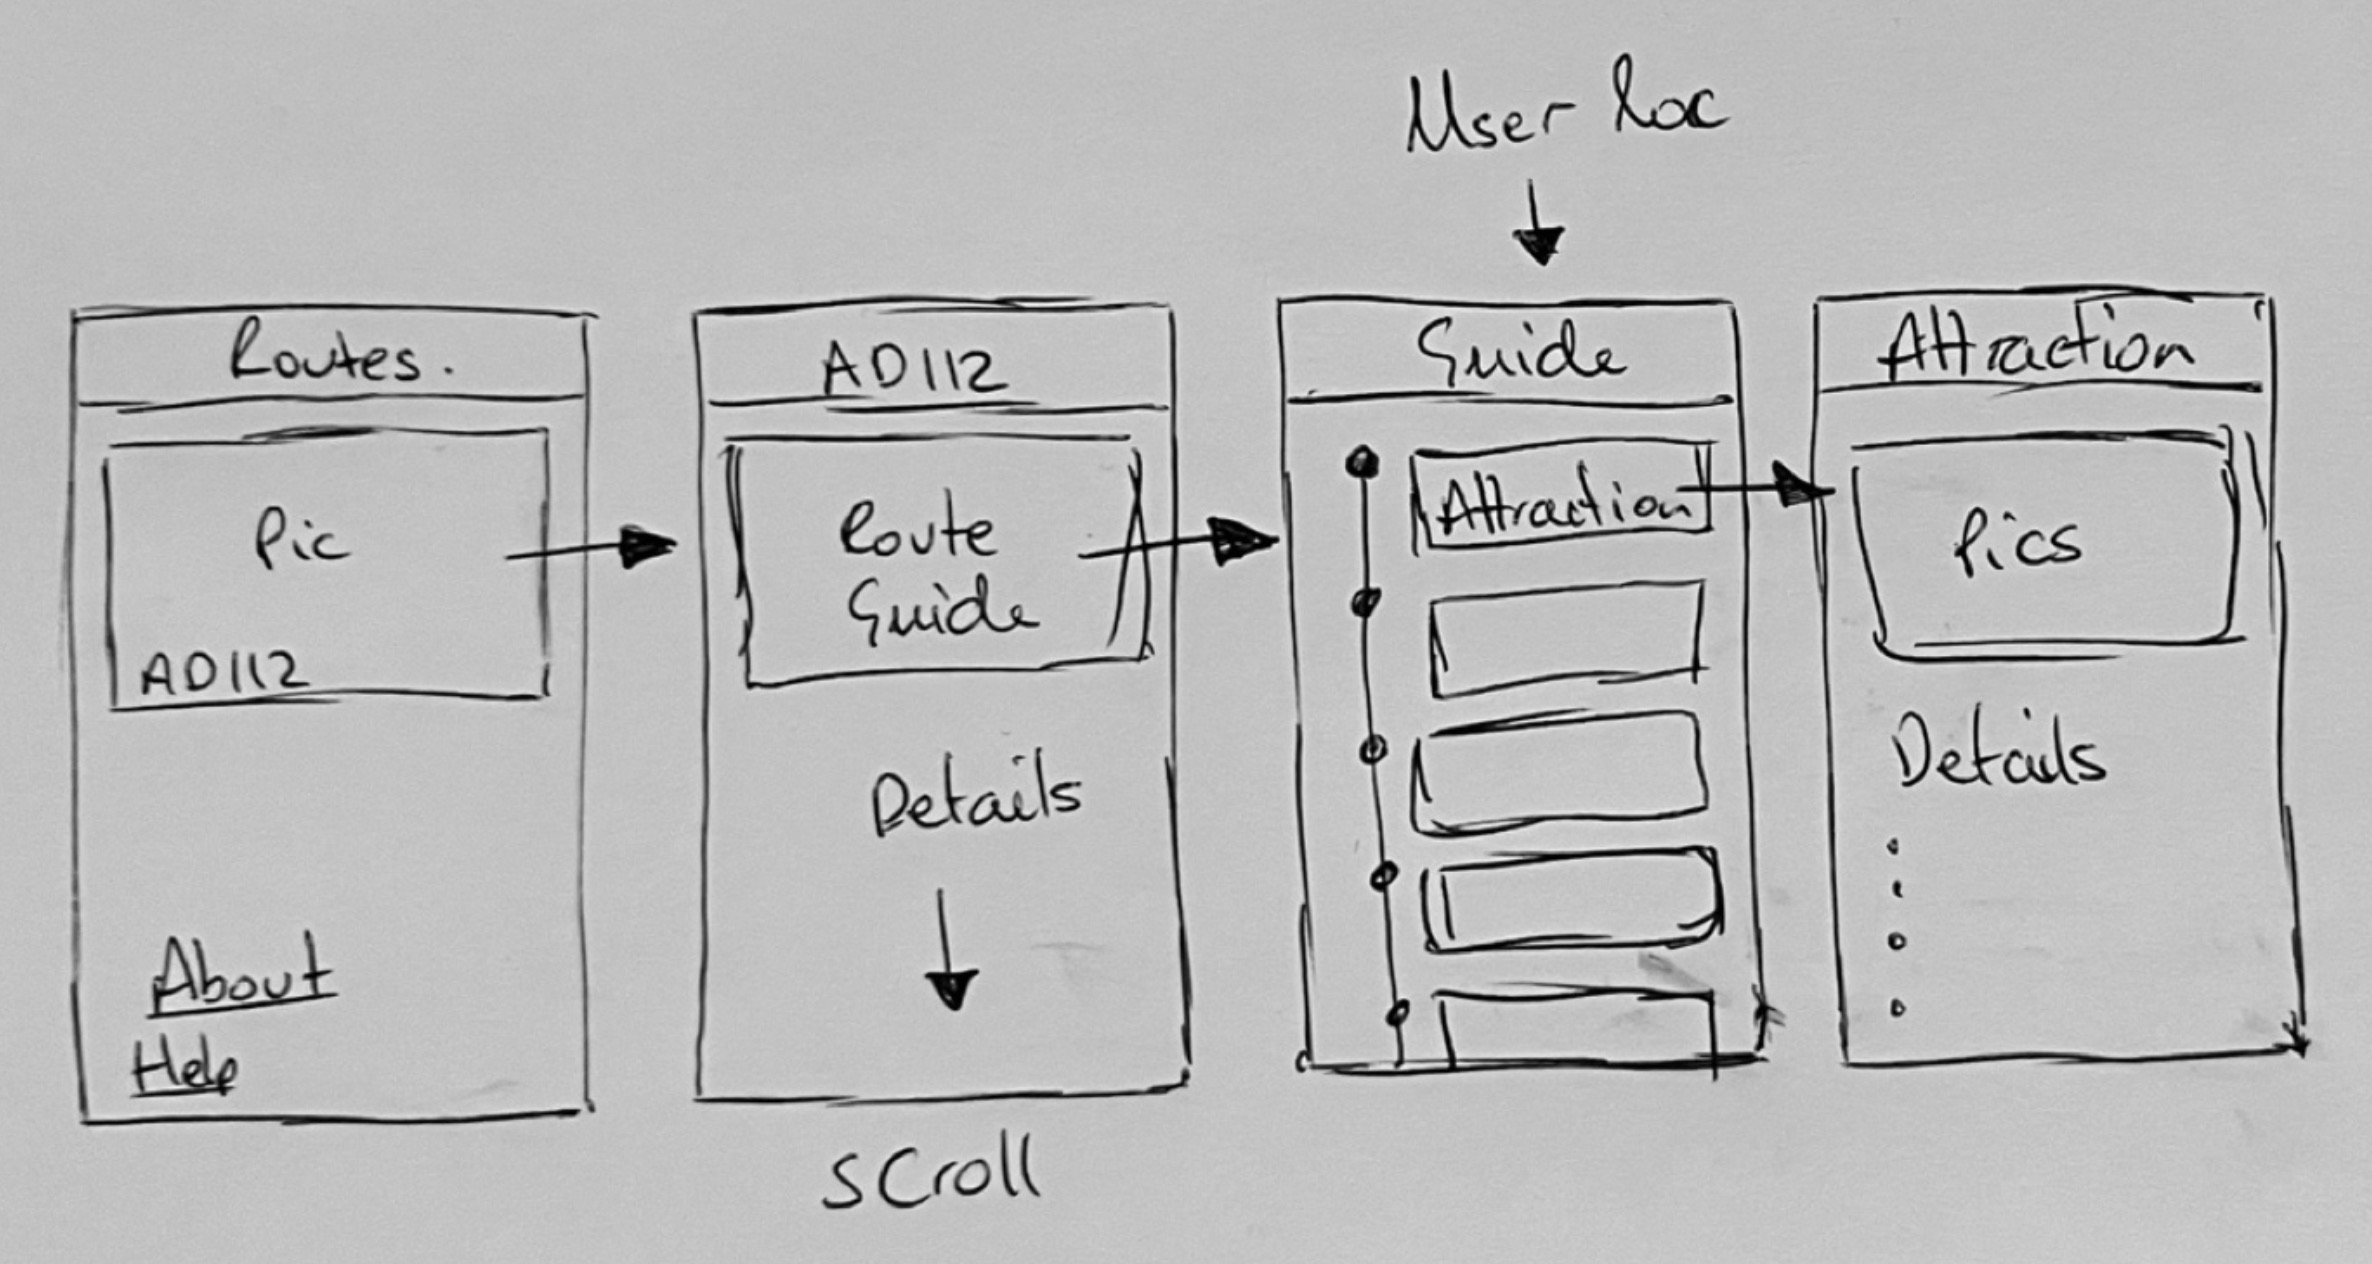
An additional factor that was important to consider at this stage was the applications architecture and structure. As seen in Figure 22, the user is greeted with a landing page from which they can explore further through nested routes. The arrows signify click points to navigate from one screen to the next. The specifics of this architecture and user journey will be discussed further in section 3.4 with the use of UML diagrams.
3.3.2 Digital Mock-ups
From the initial sketches, digital mock-ups were produced for the application using basic HTML and CSS code to represent the structure and design of the mobile application screens.
Figure 23 illustrates the appearance of the home screen. The home screen will contain a scrollable list of all available bus routes with a picture. For this project it will only show the AD122, however, it will be architectured such that additional routes can be added. The picture will be a clickable interface that links to the route screen seen in Figure 24. This will have another clickable picture or graphic to the route guide, as well as basic details about the bus route and links to the bus operating companies’ websites.
Figures 23 & 24: Digital mock-ups of the home and route screens.
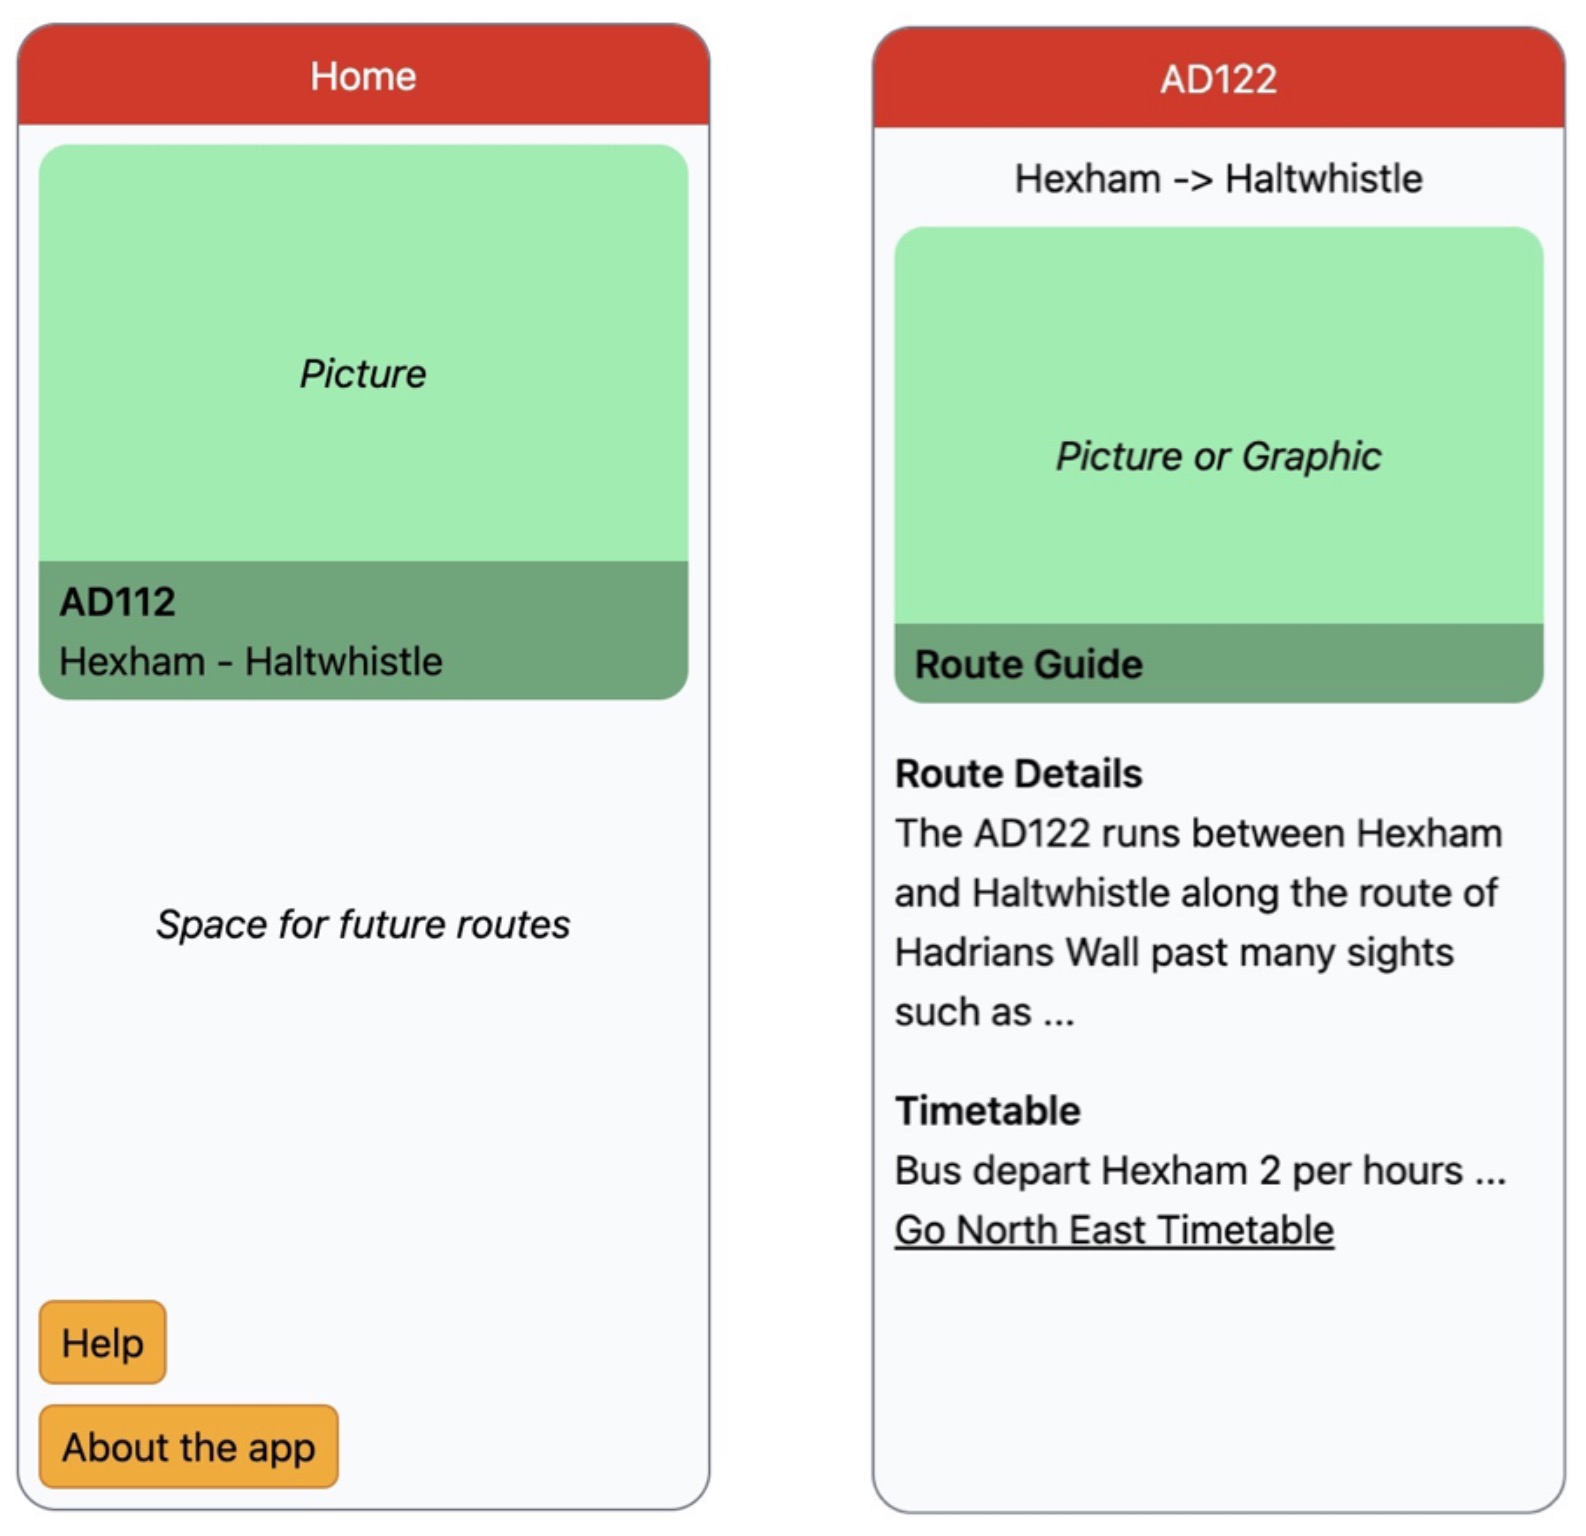
Figures 25 & 26: Digital mock-ups of the route guide and attraction screen.
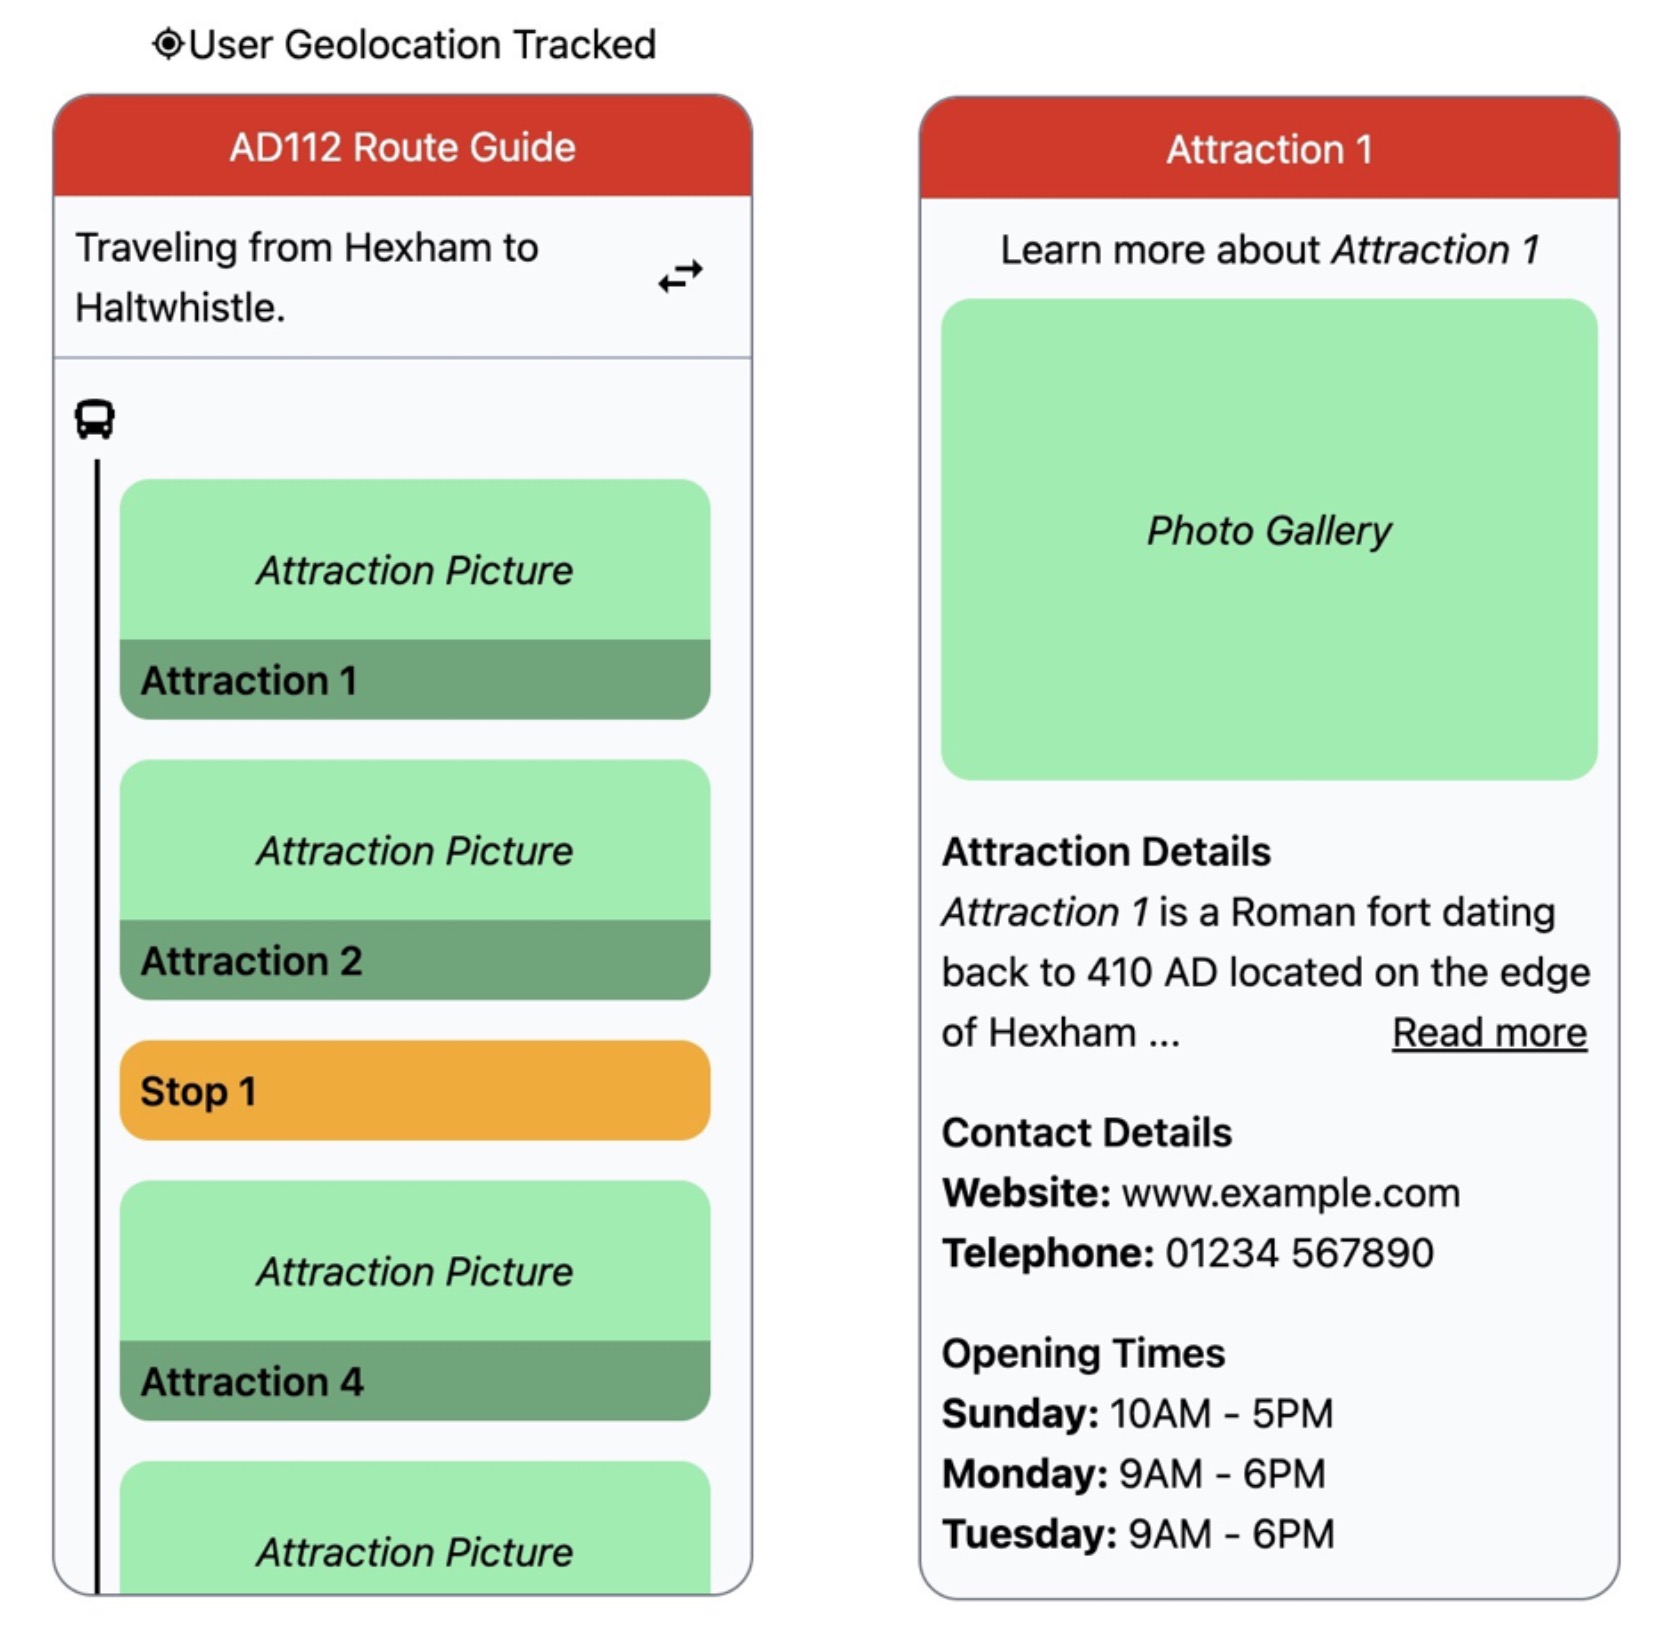
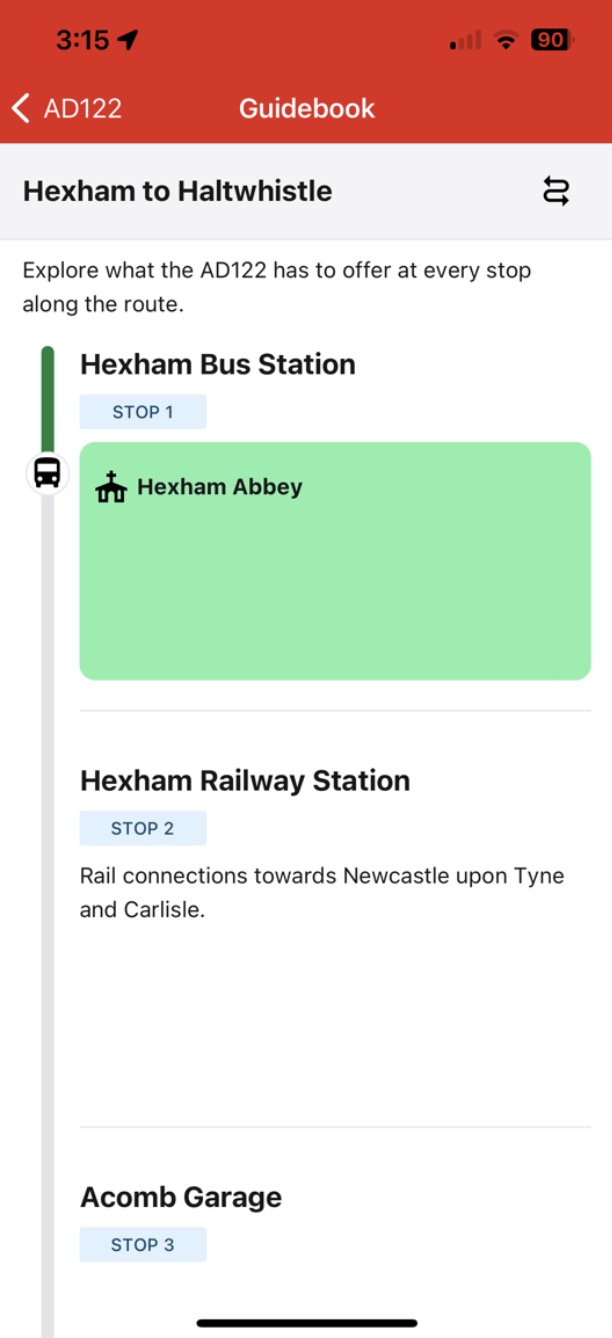
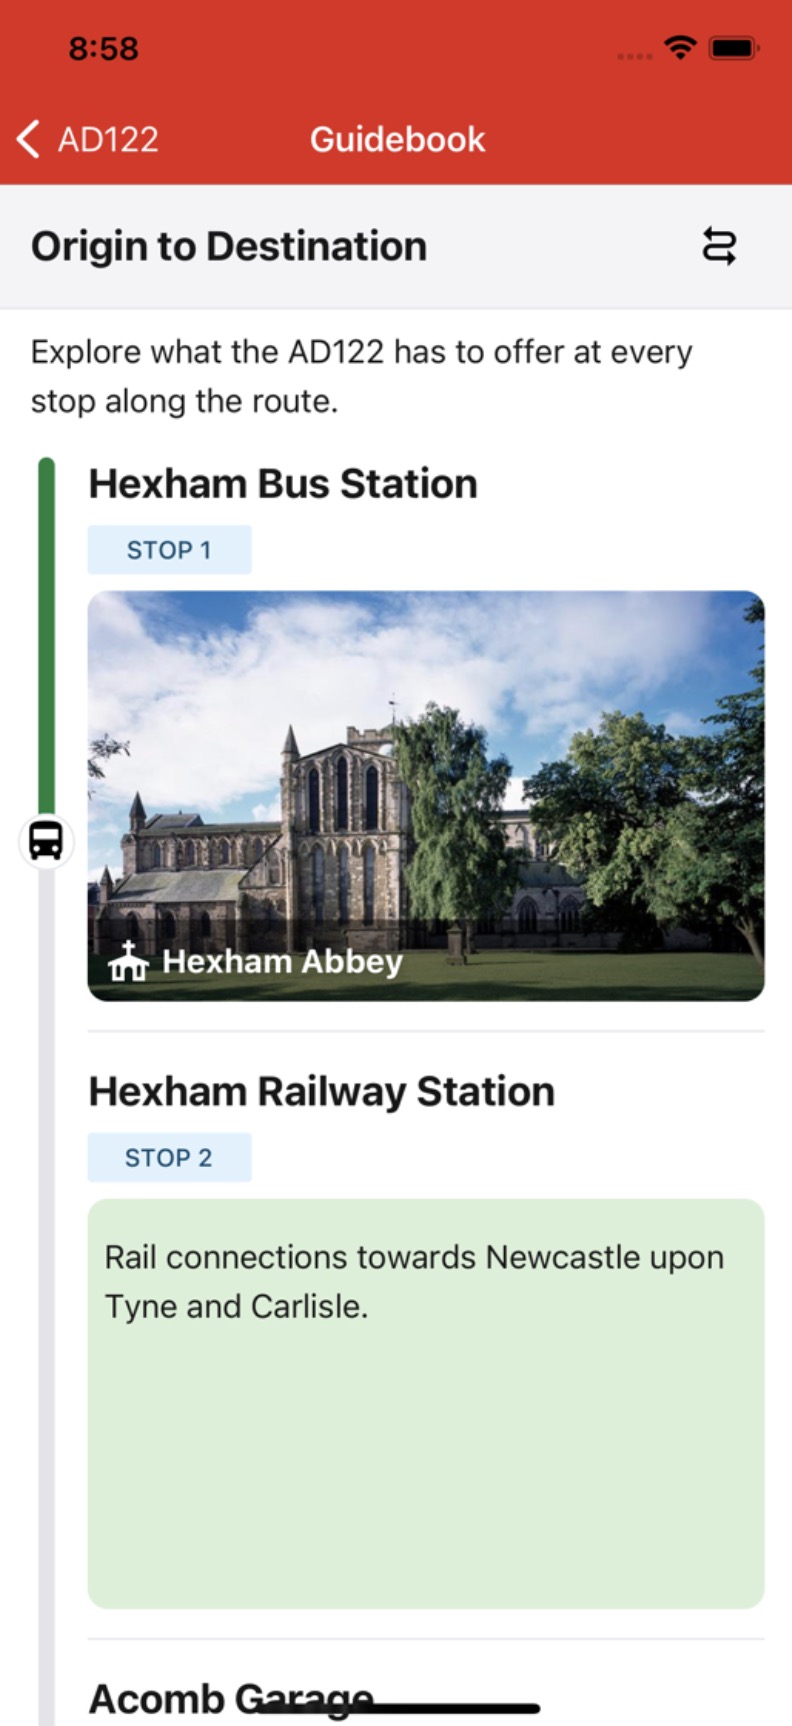
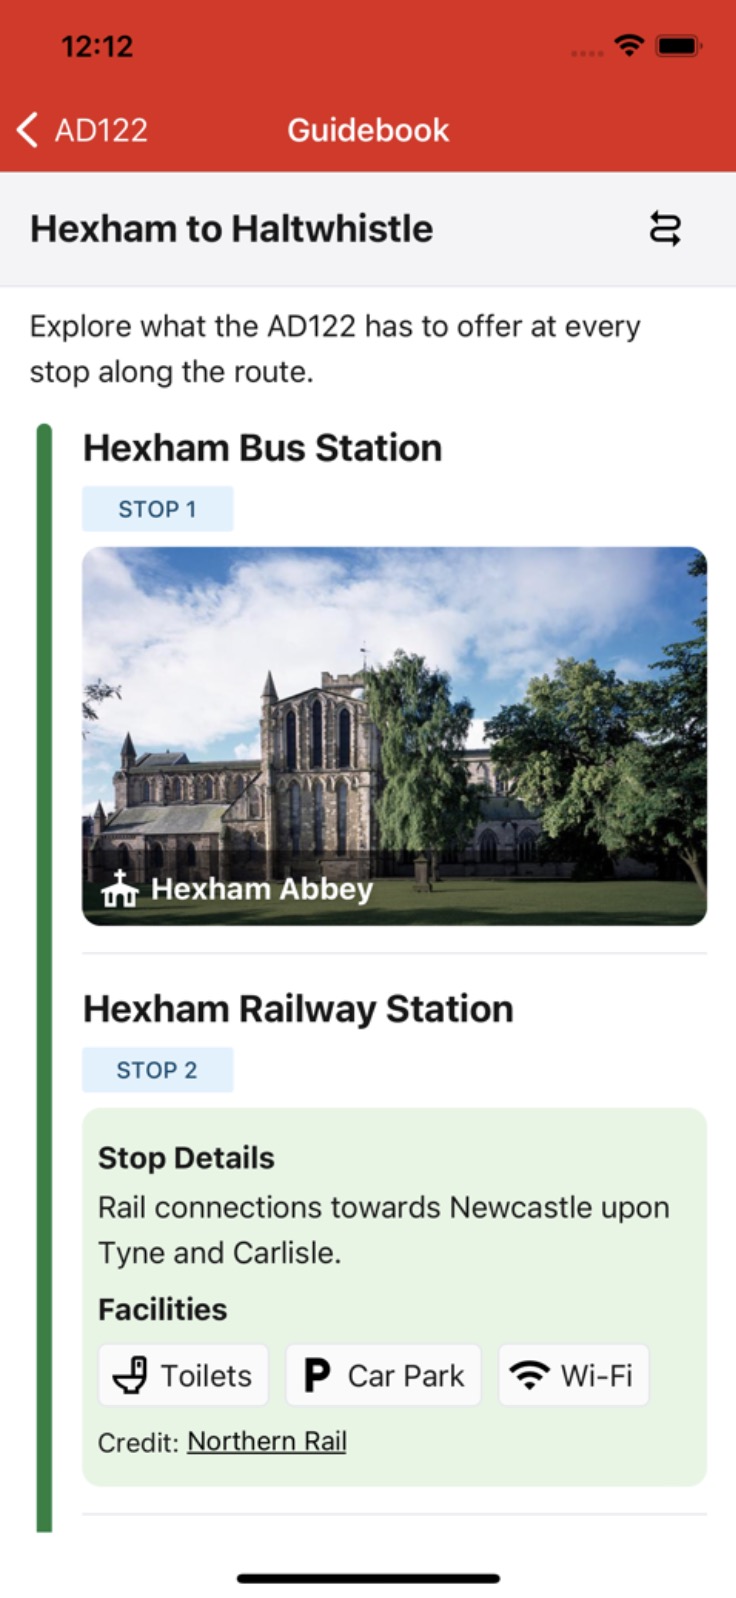
Figure 25 illustrates the route guide screen. This application screen acts as the main guidebook component for the route through a user interface that lists all the routes stops and points of interest (referred to as “attractions”). The screen will feature a vertical progress bar, seen on the left side, which will follow along as the route progresses. It will use several data points combined with the user’s geolocation to achieve this effect. Each attraction on the guide page will be a clickable element to take users to the attraction screen (Figure 26). This will contain more detailed information on each attraction such as a brief description, contact details, opening times, etc.
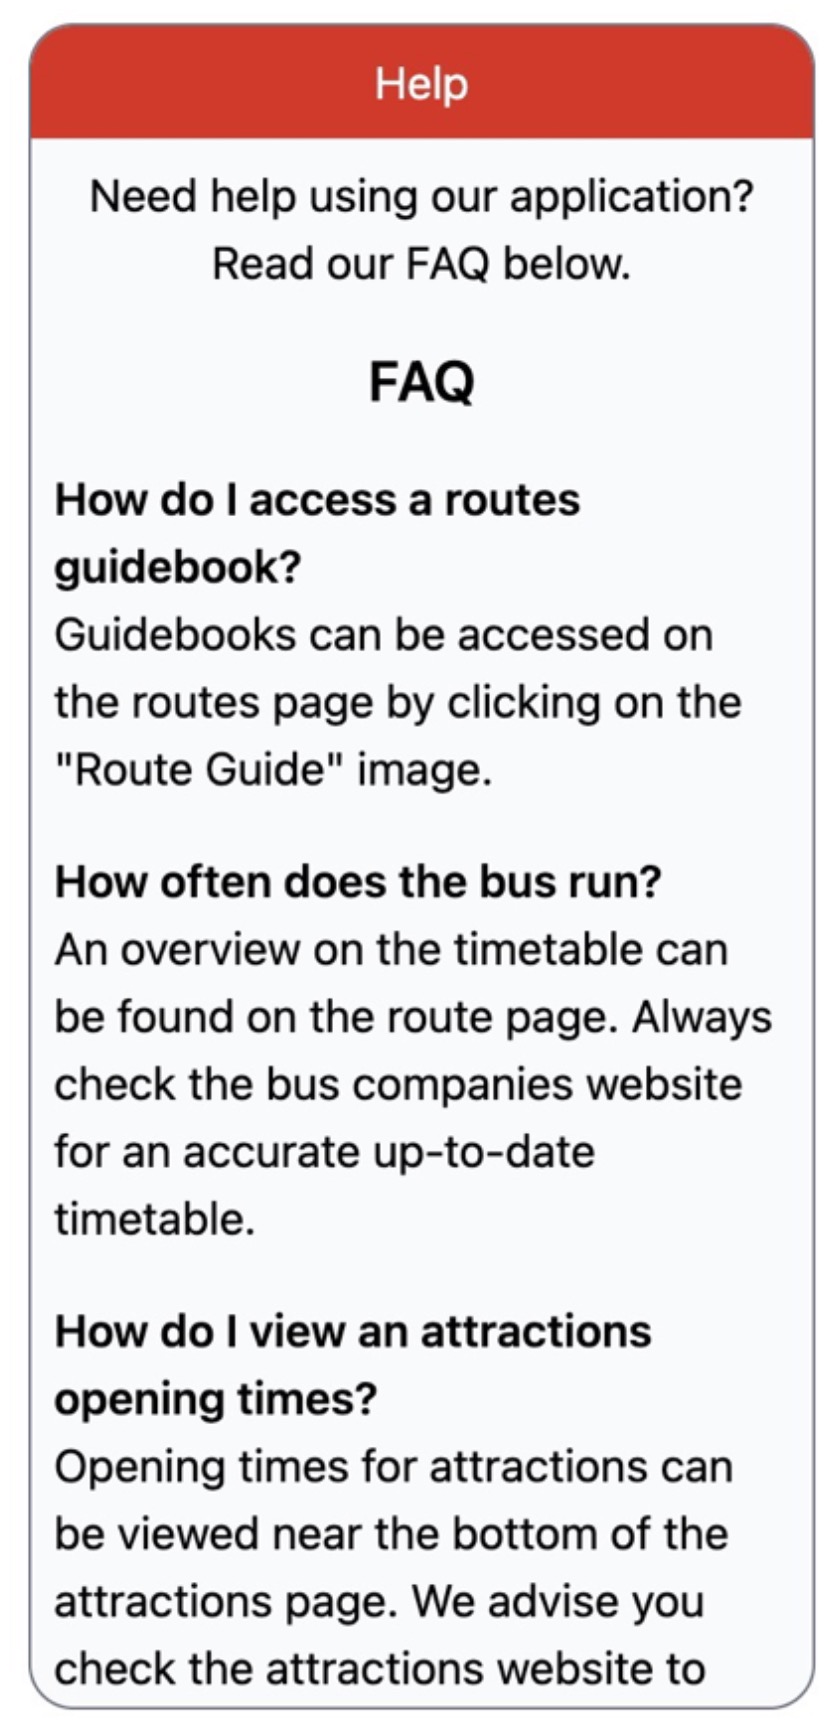
Finally, a help and about screen will be included and linked to from the home page. The help screen shall act as an in-app user manual for users to get assistance with using the application, whereas the about page will contain basic information about the application and full accreditation to sources used to produce the app. A mock-up of this is shown in Figure 27.
Figure 27: Digital mock-ups of an example help screen.
3.3.3 Application Colour Scheme
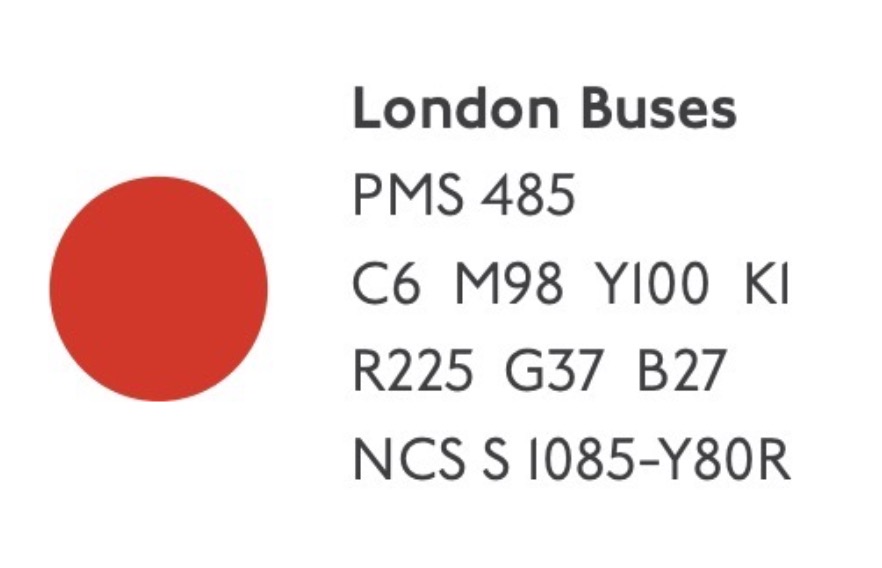
The digital mock-ups produced take inspiration from the iconic red London bus colour which is commonly recognised with public transport in Britain. Additionally, the application will aim to include green-coloured elements through its use of media such as photos to appeal to the scenic background of the bus routes. This choice draws on the evaluation of existing applications in section 2.1 which noted the appealing aspects of the Big Bus Tours (2023) branding colours and Scenic Buses green colour scheme.
Figure 28: Screen capture of Transport for London (2022) colour standards.
Red and green colour blindness is common among those with vision impairments (Colour Blind Awareness, n.d.). Therefore, it will be key to ensure the accessibility of the app is not hindered by this choice of colour scheme. To test this the application will be run through a colour blindness checker during its testing.
3.4 System Architecture and UML Diagrams
The following UML diagrams help illustrate the application’s architecture and how the application should respond to user requests. Diagrams were created using Draw.io (2023), an open-source diagramming application.
3.4.1 Overall Architecture
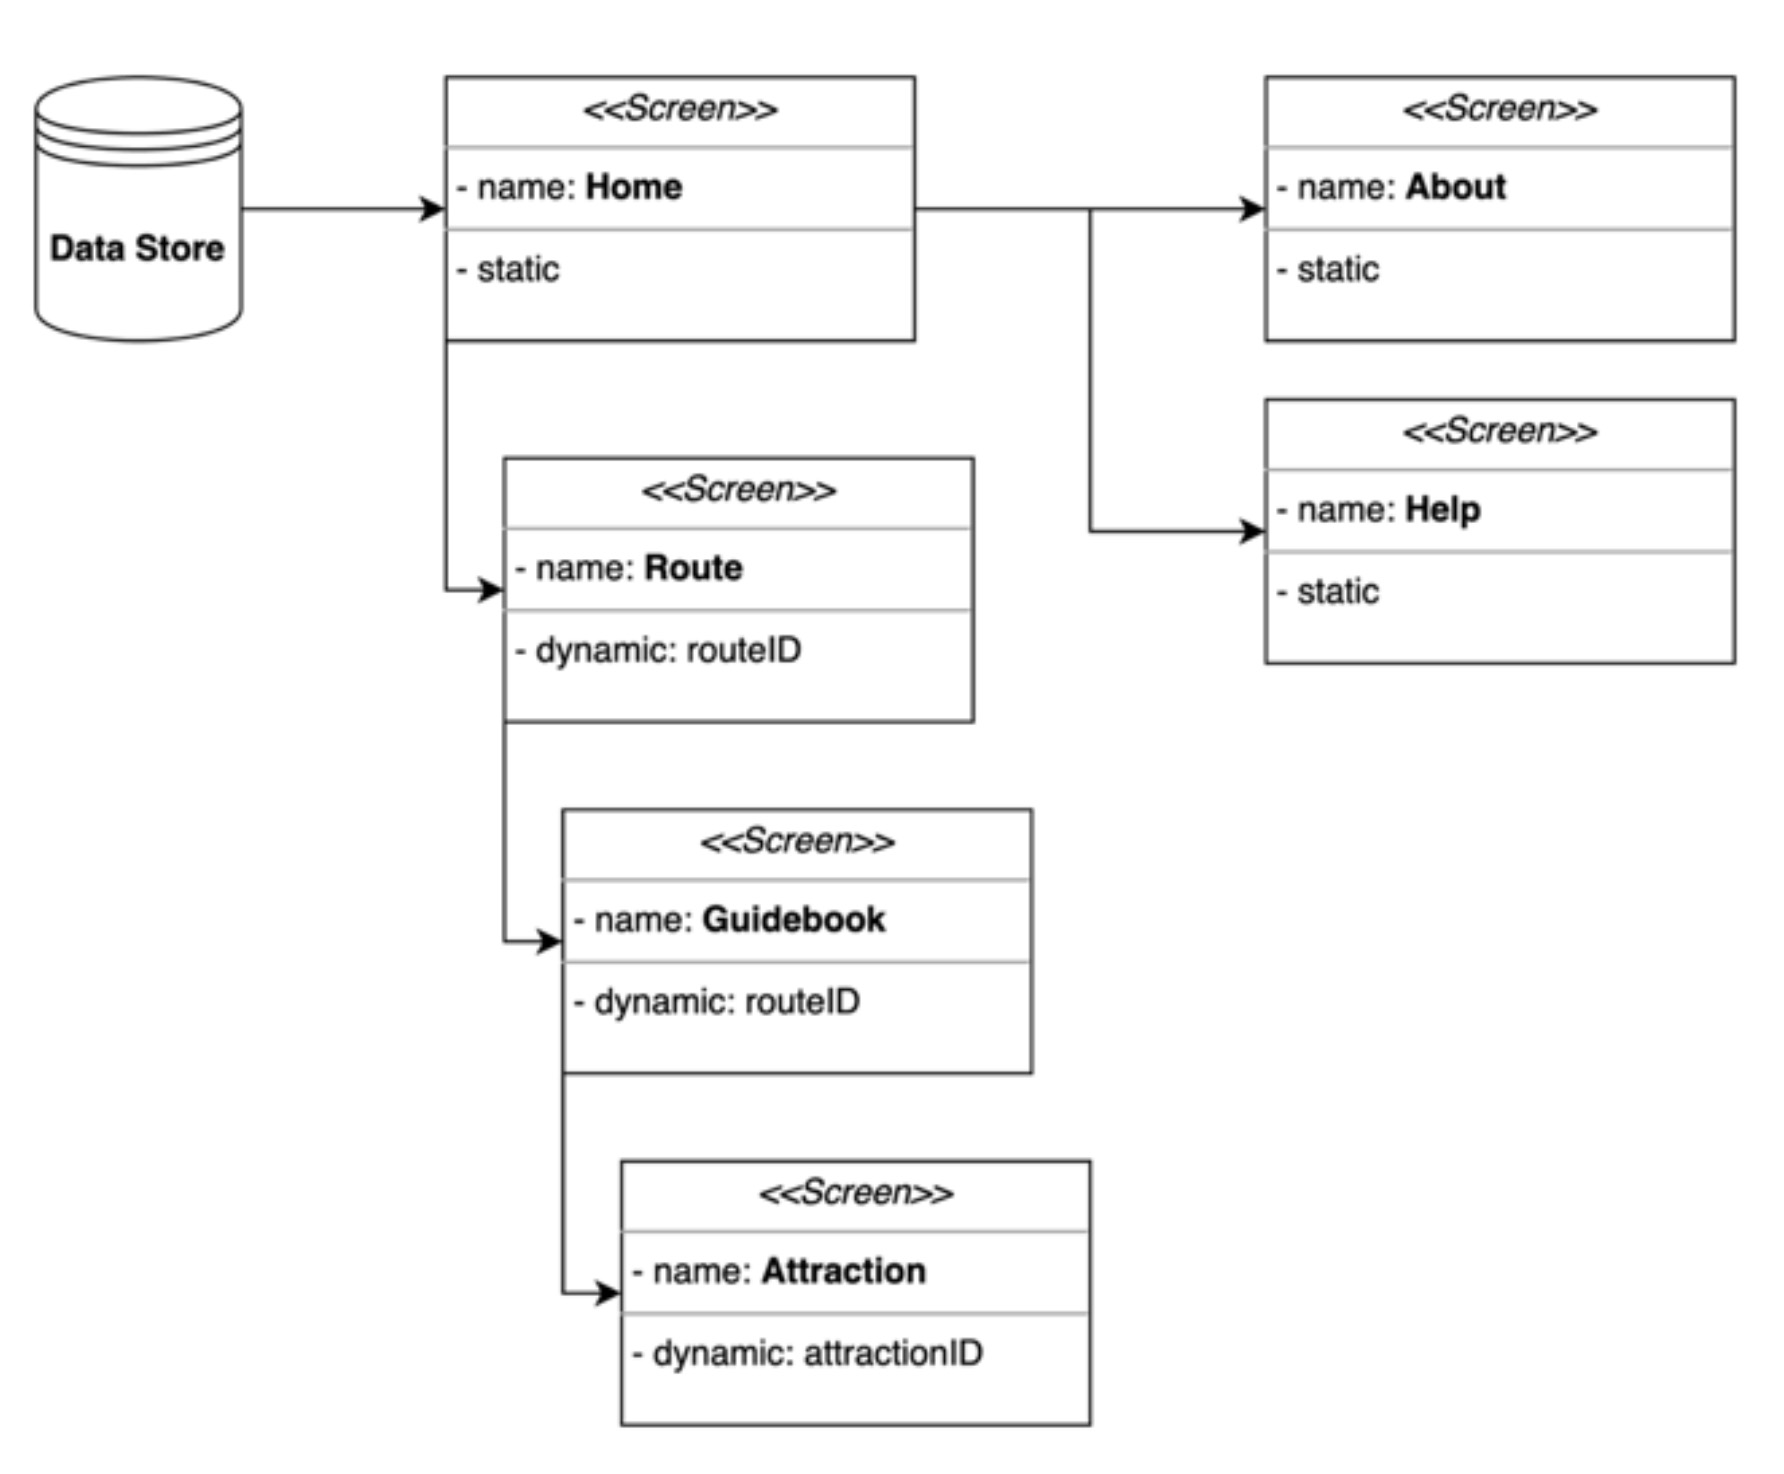
As briefly discussed in section 3.3.1, the app will be structured as a collection of nested screens. To meet point 3 of the in-scope features and NFR2 the application will aim to segregate the React Native user interface and the data (i.e., data points and content for the bus routes and attractions). Instead of writing code with the data/content pre-populated directly in the React components, a separate data store will be implemented in a data directory using standalone JavaScript seed files. Liew (2019) notes this as a common method for adding initial data to a database. Through dynamic routing and React JSX templating (React, 2023a) the data can be rendered to the user interface dynamically. As data is still stored locally, it can be bundled and shipped with the application as discussed in section 2.4.3, resulting in zero network requests.
This decision helps achieve separation of concerns and ensures components have a single responsibility based on the SOLID principles of application design (Naumov, 2020; Millington, 2022). Thus, screens and components become reusable aiding the project’s expandability and maintainability in the long run by creating loosely coupled components for the user interface and data/content.
Figure 29 represents this architecture, showing a separate data store which feeds data and content to the application screens. From the home screen, the user can navigate to the route screen, from which they can there access the guidebook and attractions screens. These screens will dynamically pull content from the data store based on either the route ID (the bus route number) or attraction ID. The static about and help screens are also accessible from the home screen.
Figure 29: Diagram of the application architecture.
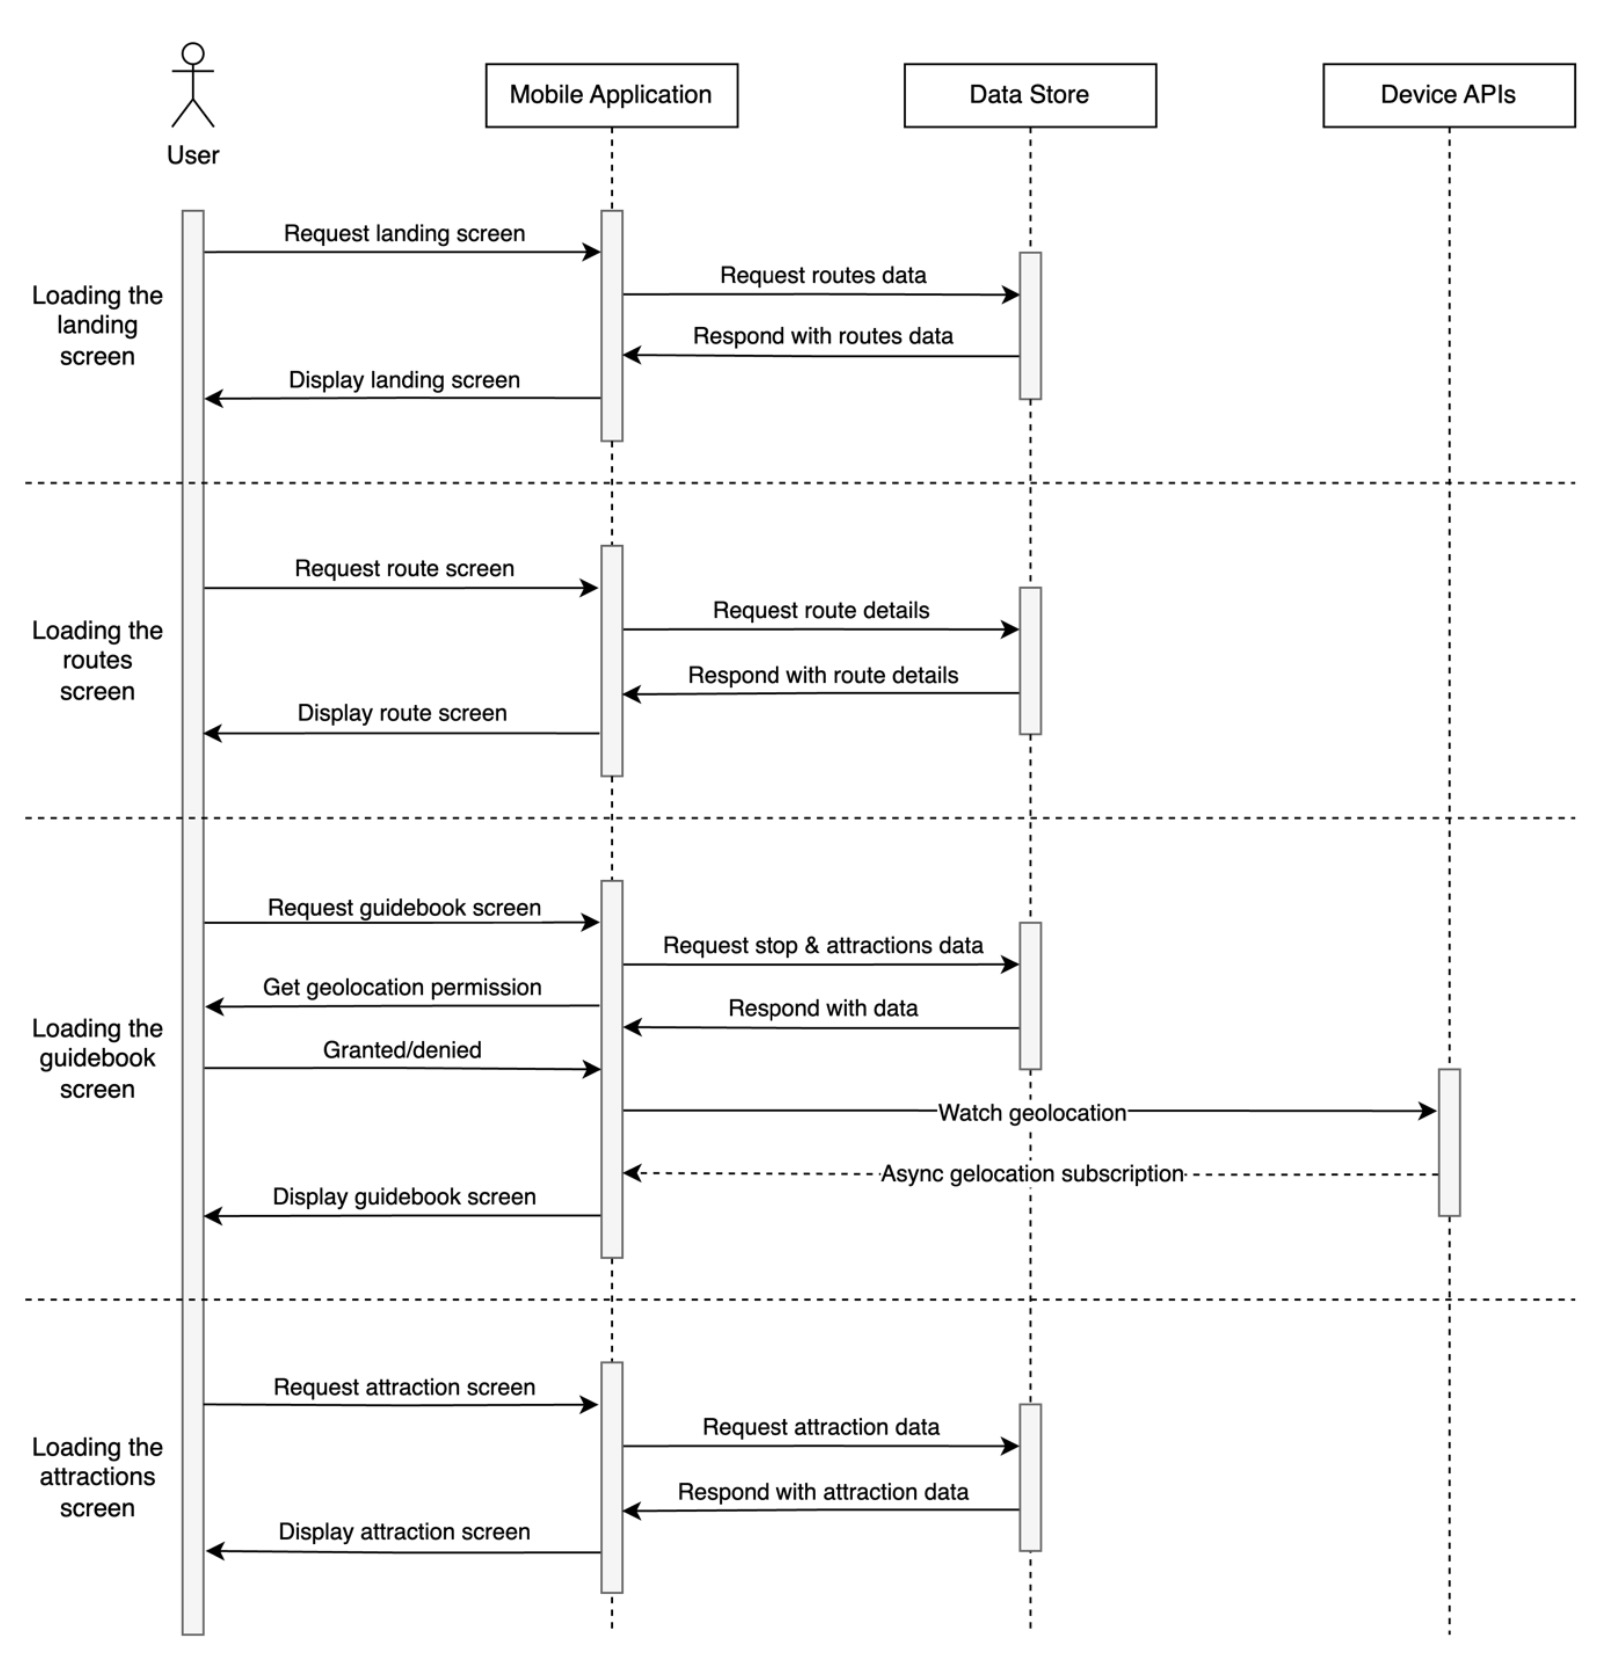
3.4.2 Sequence Diagram
The sequence diagram in Figure 30 illustrates interactions between the user and the components of the application. It details how the application will respond over time to requests from the user.
Figure 30: Sequence diagram showing user actions and responses.
3.4.3 Activity Diagrams
The following activity diagrams illustrate the flow of the application and the decisions to be made for loading various screens.
Figure 31: Activity diagram for the home screen.
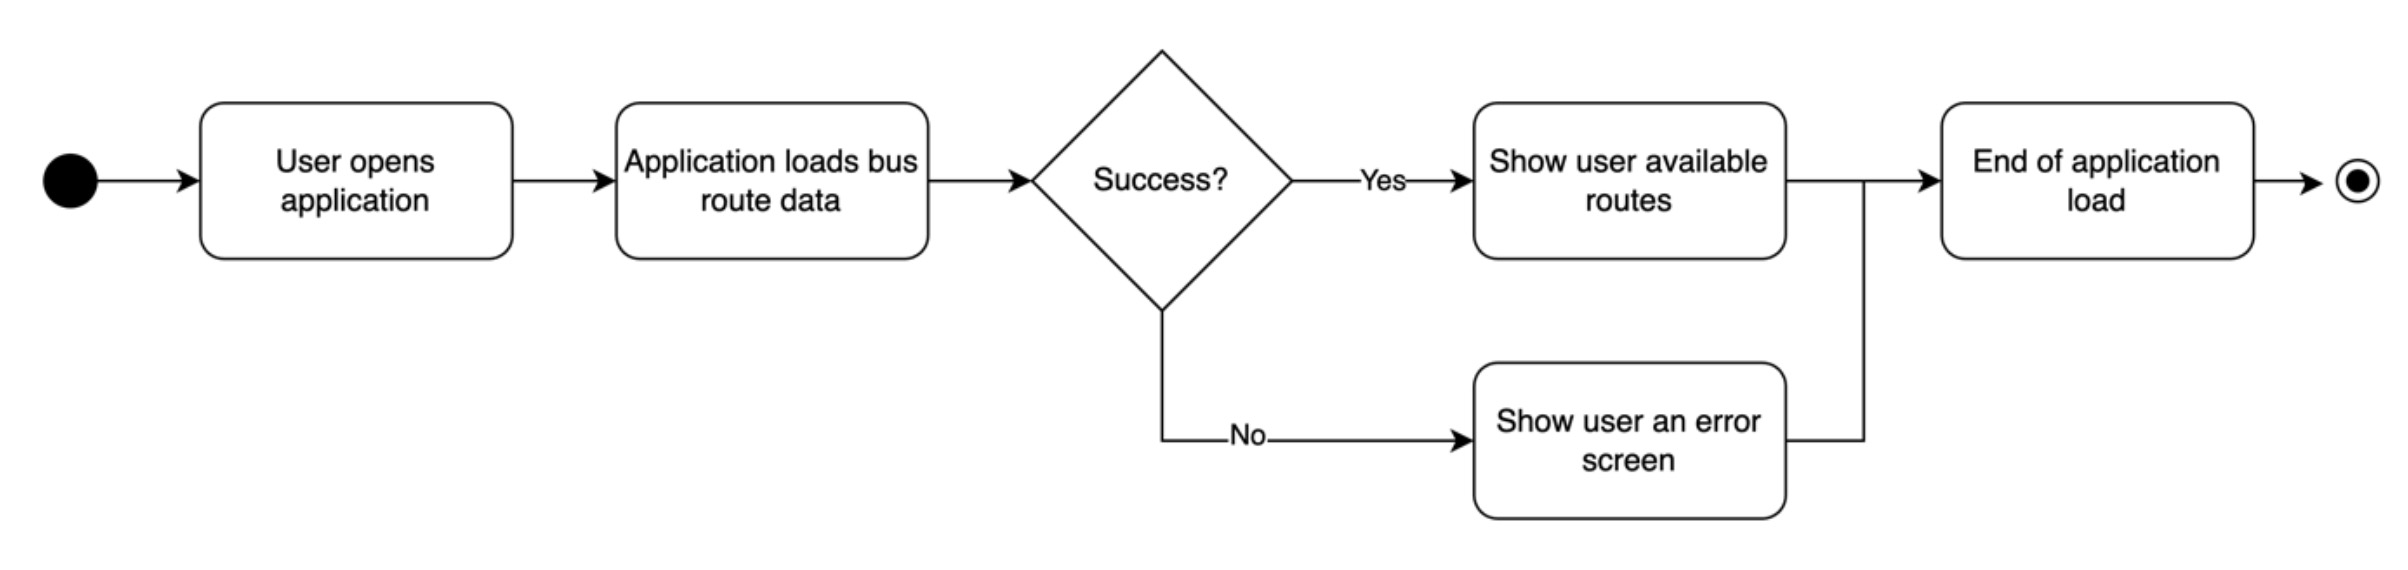
Figure 32: Activity diagram for the route screen.
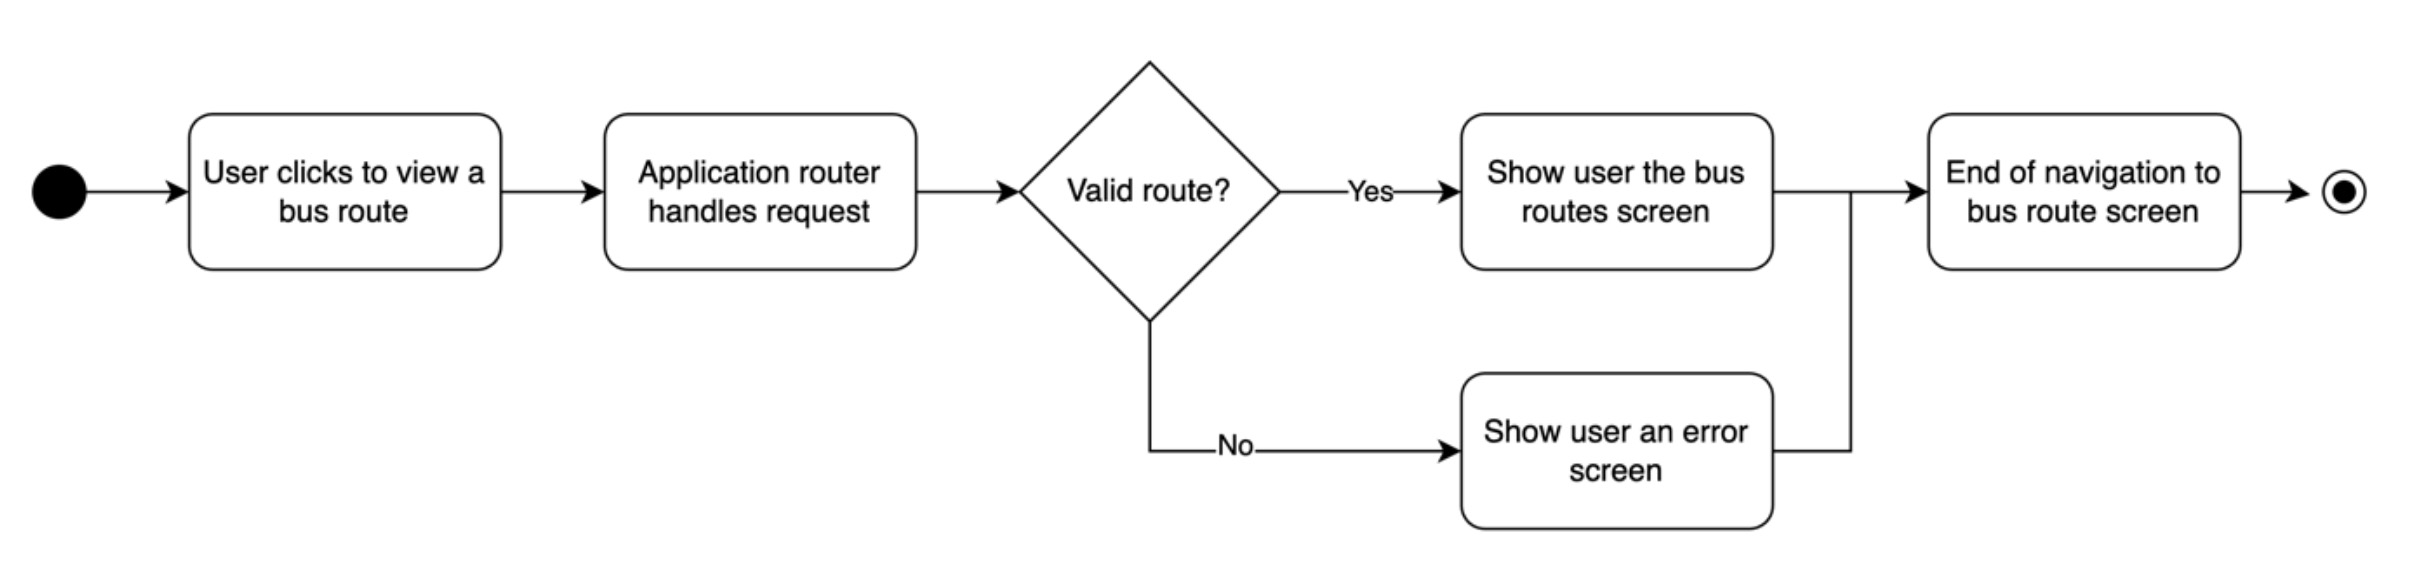
In Figures 31 & 32 the application behaviour is highly similar. The home screen will load data for a list of bus routes (each integrated into the application), whereas the route screen will load a singular bus route.
Figure 33 illustrates the behaviour of the guidebook screen. This screen will contain the most sophisticated logic across the application as it will first need to load data on the bus route including its stop and attractions. Should these steps fail an error screen should be shown to the user. Secondly, it will need to ask for permission to use the device’s geolocation features (if not already granted). From this data, the application will be able to calculate the current position along the route and identify the closest stop and attractions.
Figure 33: Activity diagram for the guidebook screen.
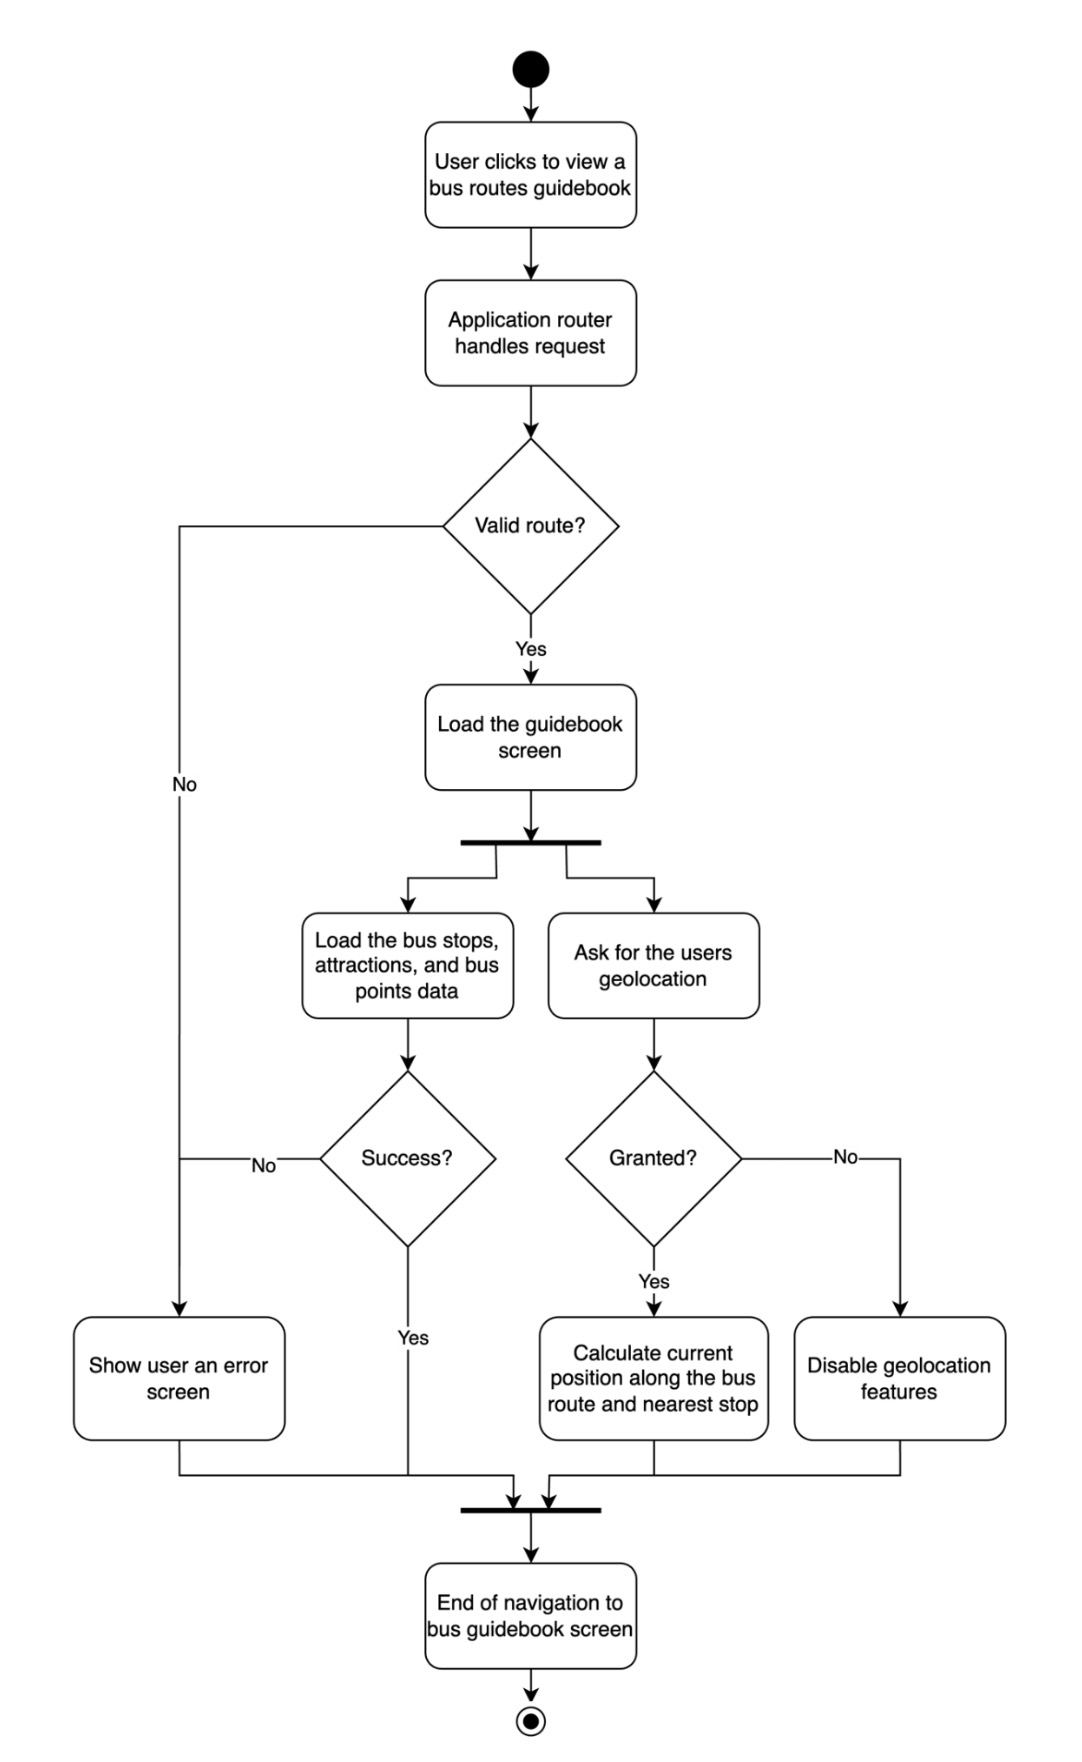
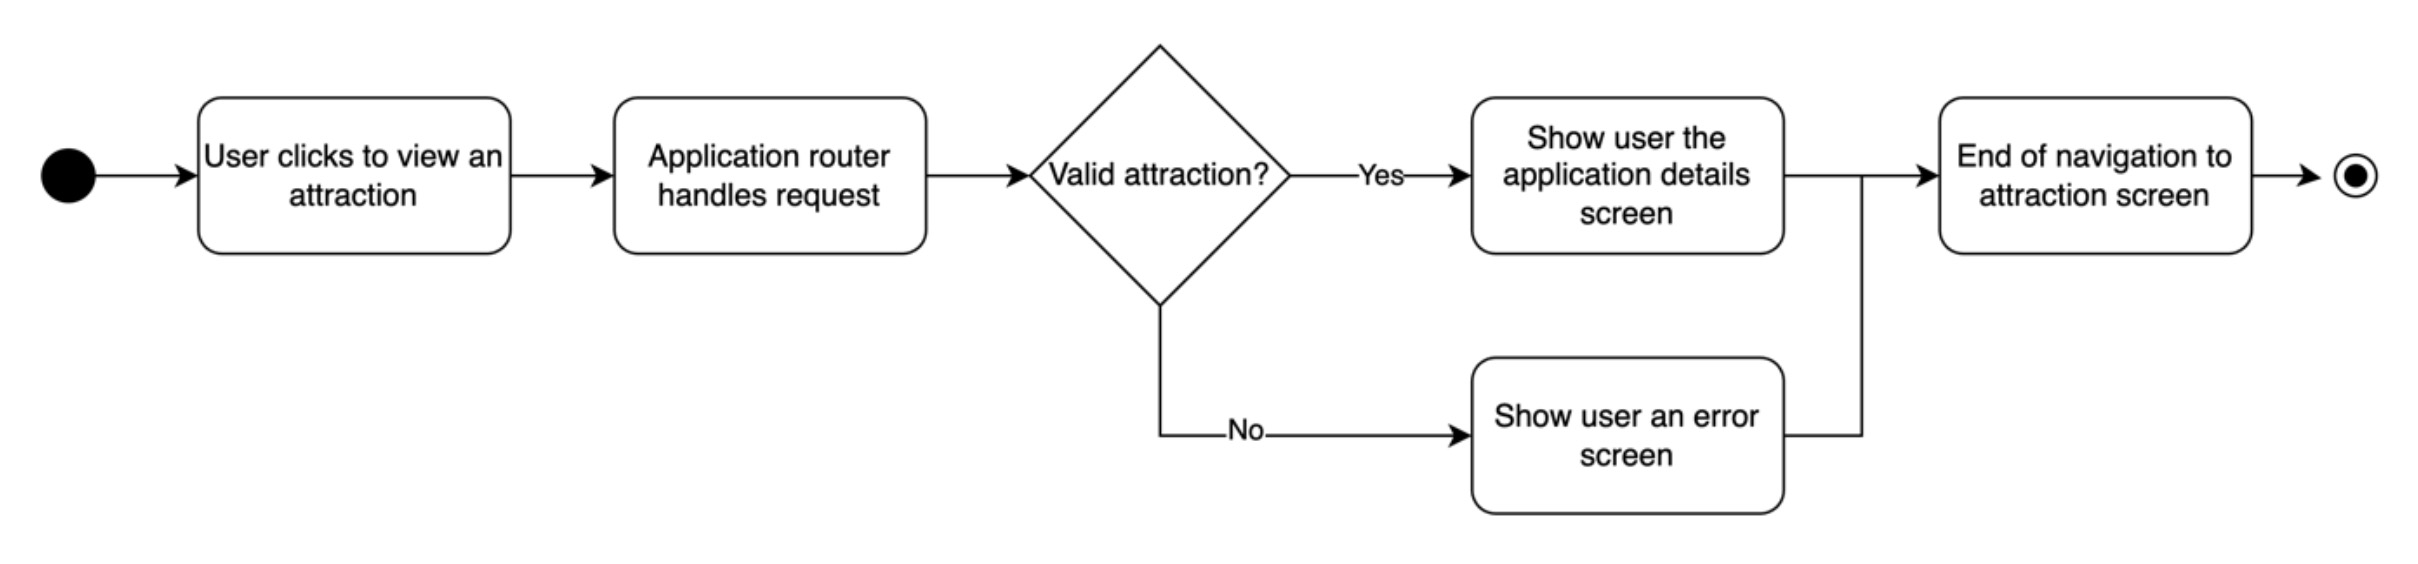
Figure 34 shows the behaviour of the application for the attraction screen. Similar to the home and route screens, data on the attraction will be validated and loaded from the data store to be displayed.
Figure 34: Activity diagram for the attraction screen.
Finally, Figure 35 illustrates the behaviour of loading the help and about screens. These are static screens; hence no data needs to be pulled from the data store as with other screens.
Figure 35: Activity diagram for the help/about screens.

3.4.4 Class Diagrams
The class diagrams provide a lower-level detailed illustration of the application design such as the data types used in the data store component and the React Native application components and functions.
Representing data in native JavaScript can be problematic as JavaScript is a dynamic and weakly typed programming language (Mozilla, 2023b). Consequently, data types can be reassigned at runtime and Integrated Development Environment (IDE) software has limited support for type-checking JavaScript codebases. As a result, this project will use TypeScript (2023) a programming language that builds on JavaScript to provide strong typing. TypeScript further seamlessly integrates into React Native projects (React Native, 2023a).
Figure 36 is a class diagram produced to show how the data store component will be set up using TypeScript Types Aliases (W3Schools, n.d.) to represent the various custom data types which will be exported throughout the application. Each type will have multiple fields representing the data required to be stored for each.
Figure 36: Class diagram of the data store.
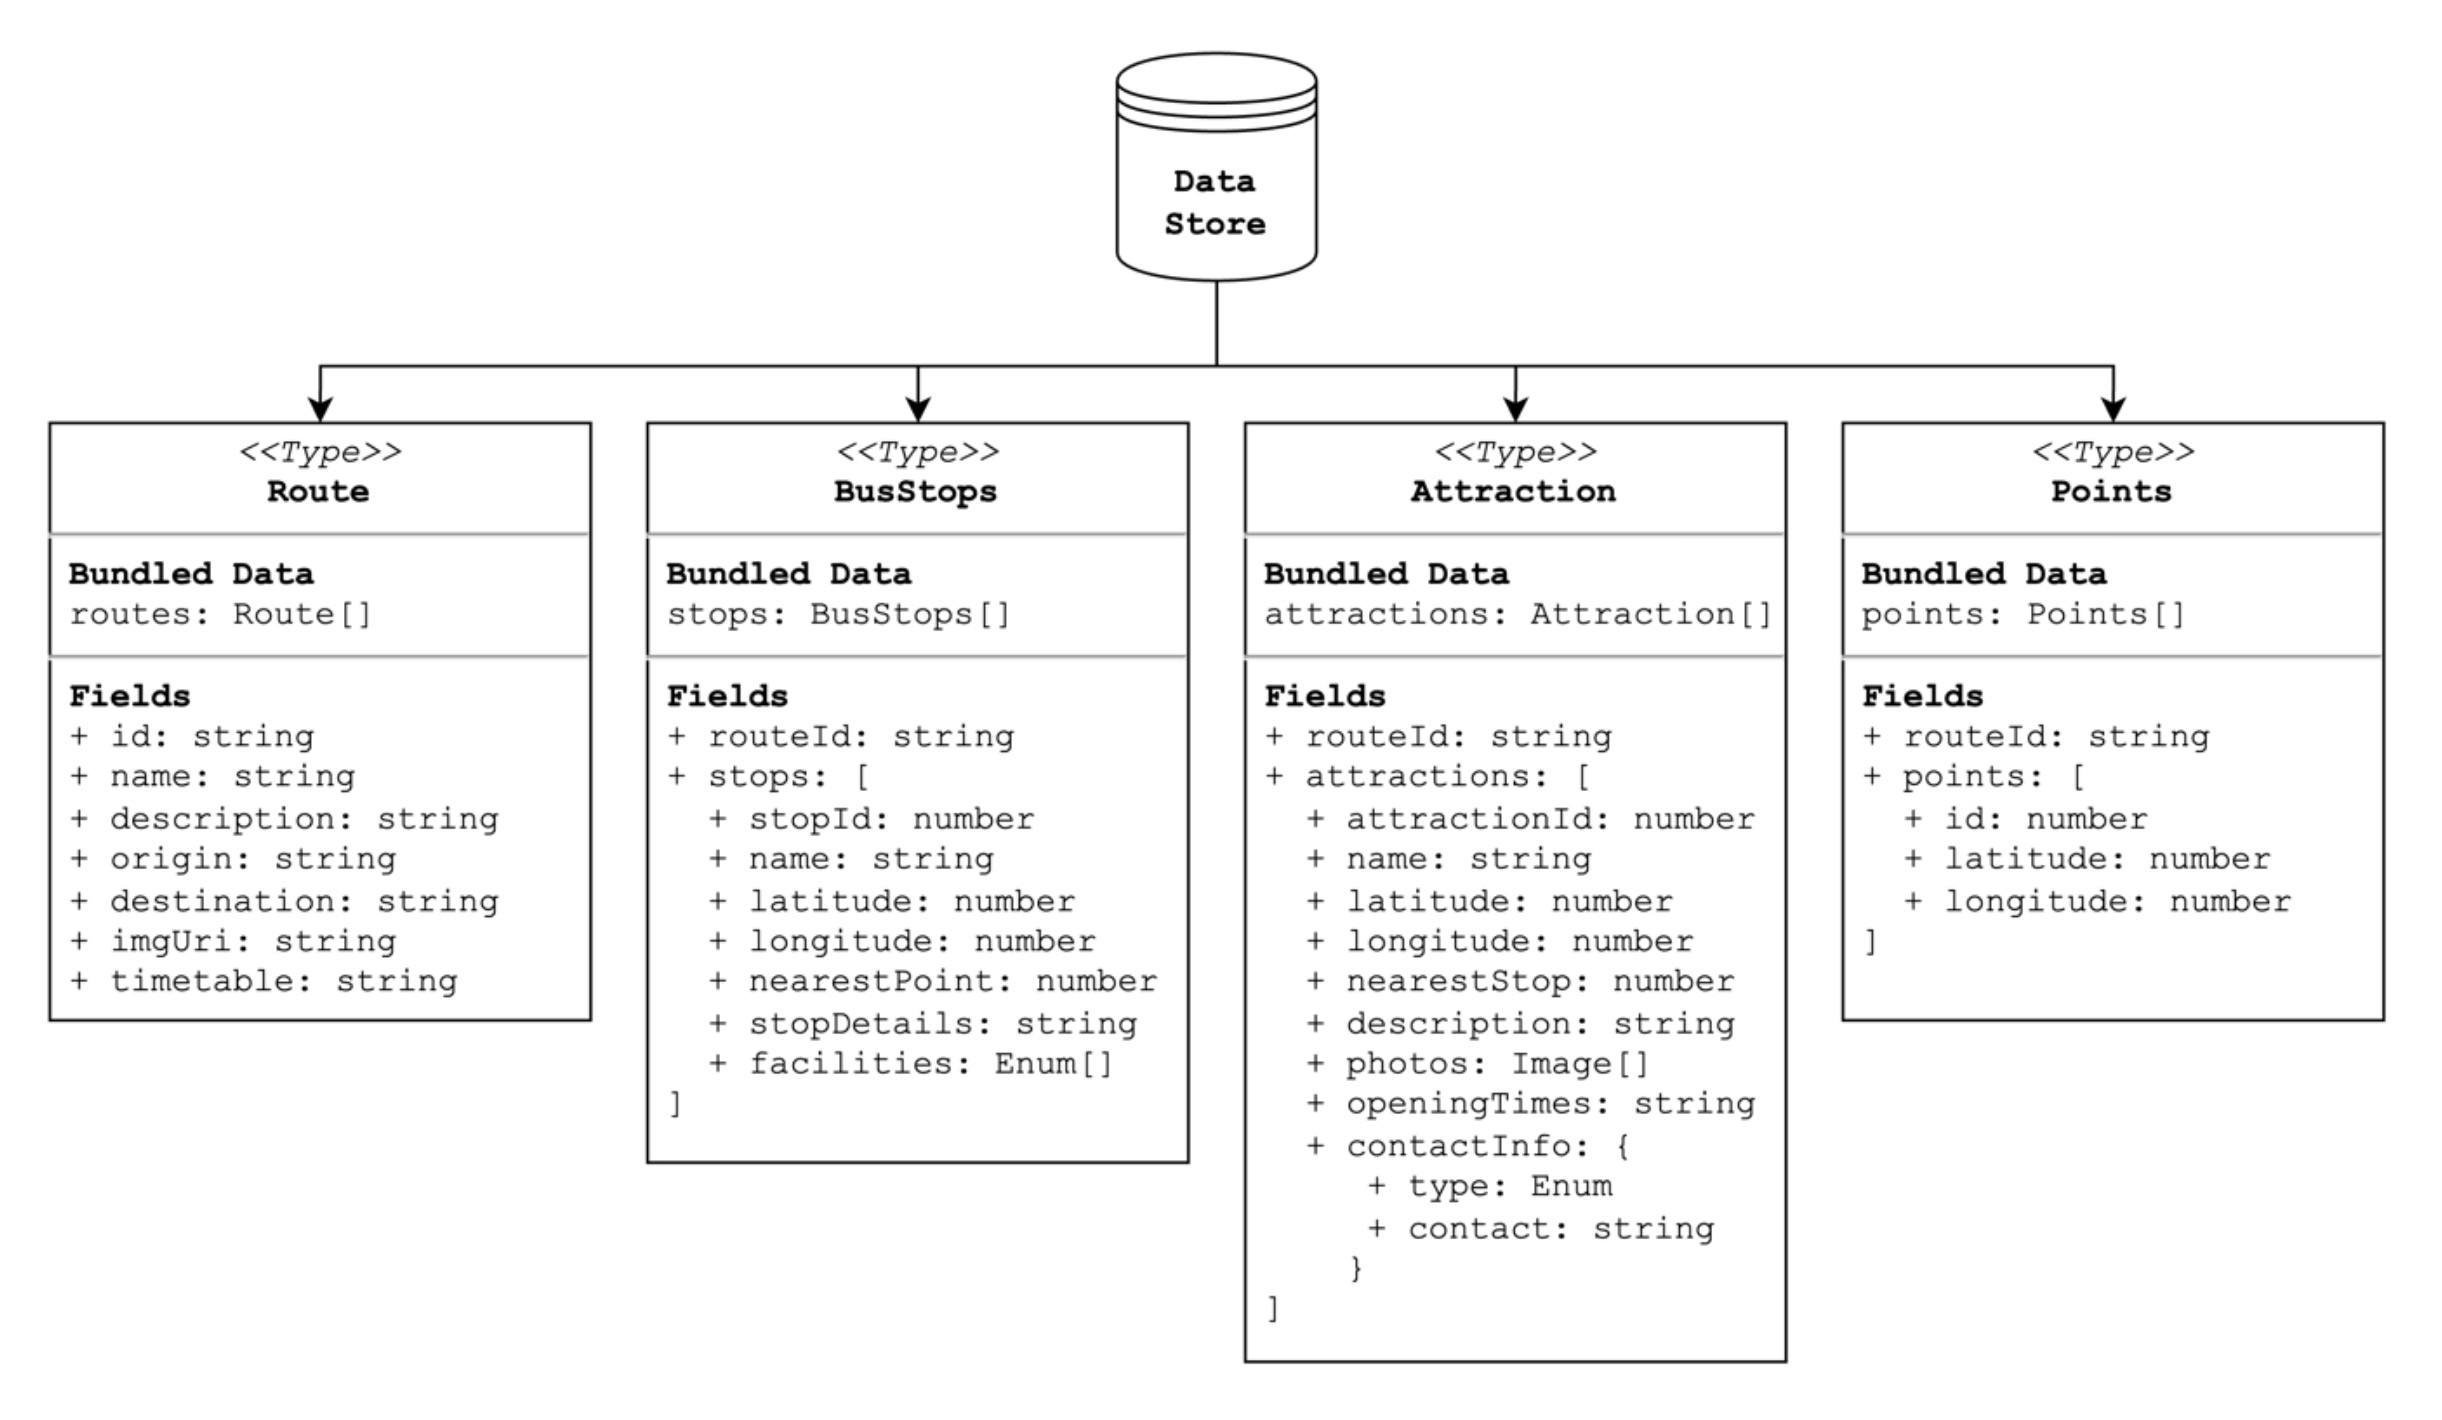
One advantage of this approach is that the data store types can be shared directly into the React Native application, consequently ensuring type safety across the entire codebase is achieved. This will be beneficial for dealing with complex data such as latitude and longitude values and relational fields, thus reducing bugs and developer errors which might otherwise occur from using JavaScript’s dynamic typing system.
Another advantage of this approach is its expandability. The four data types depicted in Figure 36 will essentially be strongly typed JavaScript Objects which get exported from a data directory into UI components. Should the application ever expand to support many bus routes, it is likely the data store would be moved to a new backend system to make managing and updating the routes easier. A popular format for accessing data from a backend system (such as a REST API or CMS) is JavaScript Object Notation or JSON for short (JSON, n.d.). Since the data store will utilise JavaScript Objects, it is highly probable that it can be made compatible with JSON. This would minimise the need for any significant changes in the codebase to facilitate the expansion to a backend solution.
Finally, Figure 37 shows a class diagram for the React Native mobile application. React use regular JavaScript functions to export reusable, interactive, and stateful UI components (React, 2023b). App.tsx (a standard naming convention) will be the entry point for the application and shall handle navigation (also referred to as routing) to the different application screens. Each screen will then be a separate file in the codebase.
Figure 37: Class diagram of React Native application.
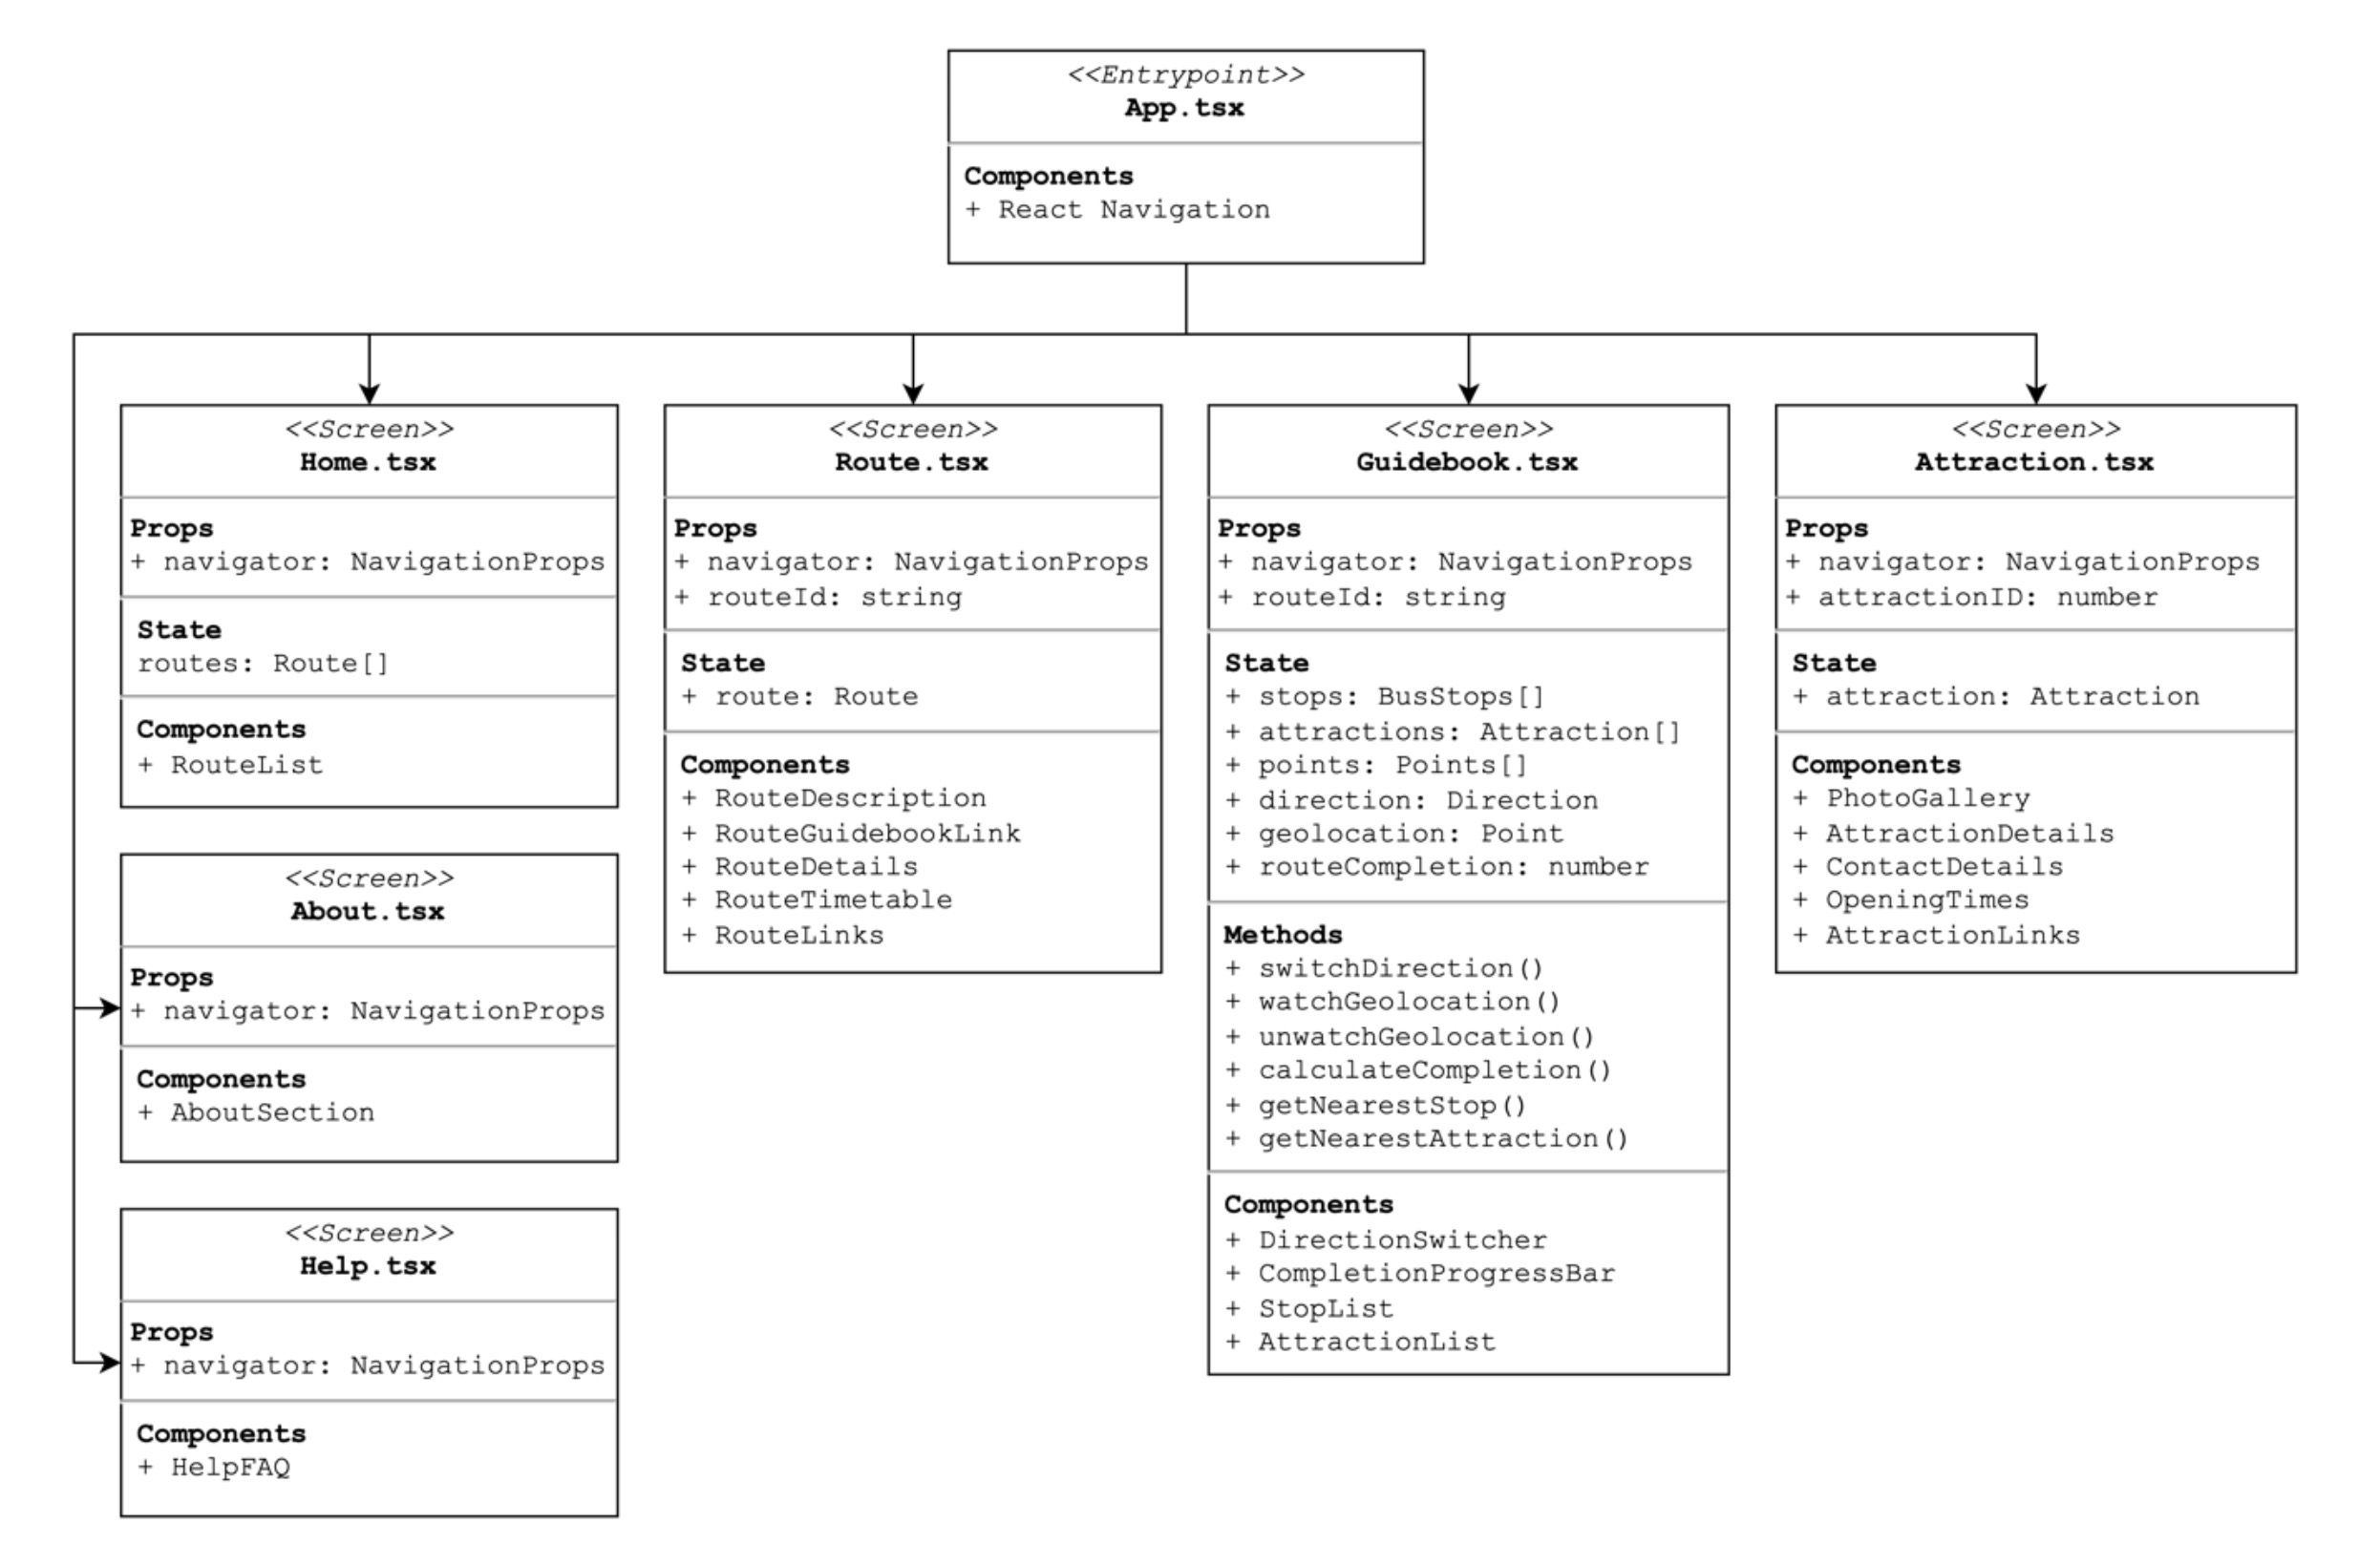
Screens may contain some or all the following: props, state, methods, and components. React (2022) defines these elements as such:
- Props: read-only inputs to React components passed from the parent.
- State: data associated with a component that may change over time.
- Methods: functions called from within the component.
- Components: React reusable UI elements.
3.5 Development Process Model and Tools
The following section will discuss the process model to be applied to this project (agile scrum) and the tooling that will be utilised throughout to deliver the end application.
3.5.1 Agile Scrum Process Model
Vanderjack (2015) discusses the agile scrum model as software engineers working in a series of iterations (also called sprints) to work through a product backlog (a list of features to be implemented) as a team or individual. Requirements (also called user stories) are prioritised to develop important features first and retrospectives take place every 2 to 4 weeks to evaluate progress and adapt to change.
For this project, the backlog of tasks translates to the requirement specification in section 3.2 providing a list of features to be implemented. As this is a solo project, it is not possible to divide tasks up by team or individual. However, using the scrum method this list will be broken down into sprints to be completed focusing on specific features or parts of the application at a time.
As this project has a shorter deadline compared to one typically found in industry, sprints will also be shorter in time. This will aim to be 3-to-5-day sprints of programming followed by 2-to-4-day retrospectives to evaluate and reflect on the progress made and eliminate blockers or adapt the application’s design as required.
3.5.2 Project Tooling
Project tooling is in reference to programs or software which will be used to aid the development process. A full list of the tools that will be used is outlined below.
- Visual Studio Code (2023) is an open-source IDE with great support for the React Native and JavaScript ecosystems.
- Expo (n.d.) is a toolchain and framework built around React Native to make mobile application development in JavaScript possible for Android, iOS, and web apps. It has a suite of software libraries, integrates with emulators, and has a mobile application to run development apps directly on a mobile phone.
- Xcode (Apple, 2023) is a suite of tools for building applications for Apple platforms. Expo requires Xcode to be installed to build and run an iOS version of the app.
- Android Studio (n.d.) is the official development environment for creating Android applications. The Expo toolchain requires Android Studio and the Android SDK to be installed to build and run an Android version of the app.
- Git (n.d.) an open-source version control system and GitHub (n.d.) a cloud service for hosting git repositories operated by Microsoft shall be used to store the code base privately in the cloud.
- Babel (2023) is a code transpiler which transforms React JSX source code and newer versions of JavaScript syntax (ECMAScript 2015+) to backwards-compatible versions of JavaScript. It is used by default in the React Native and Expo toolchains.
- Prettier (n.d.) describes itself as an “opinionated code formatter.” Through a configuration file prettier can be used to achieve standardised formatting across an entire code base.
- Node Package Manager (npm, n.d.) is an open-source package manager for Node.js which will be used for installing and managing project dependencies.
- Jest (n.d.) is a testing framework for JavaScript that enables automated mocking and unit testing of code.
3.6 Project Initialisation
The following section will detail the steps for how the React Native project was initialised, the setup of its file structure, and which dependencies were installed in the project.
3.6.1 Initialising a React Native Project
Before beginning development, a default React Native application must be initialised through the command line. React Native (2023b) discusses how this can be achieved through the Expo tooling using the command npx create-expo-app AwesomeProject to create a project named “AwesomeProject”.
However, this default command is only for a JavaScript project. For a TypeScript project, it is better to configure TypeScript out of the box, rather than retrospectively integrate it at a later date. Expo (2023a) provide the command npx create-expo-app -t expo-template- blank-typescript to use a blank TypeScript template.
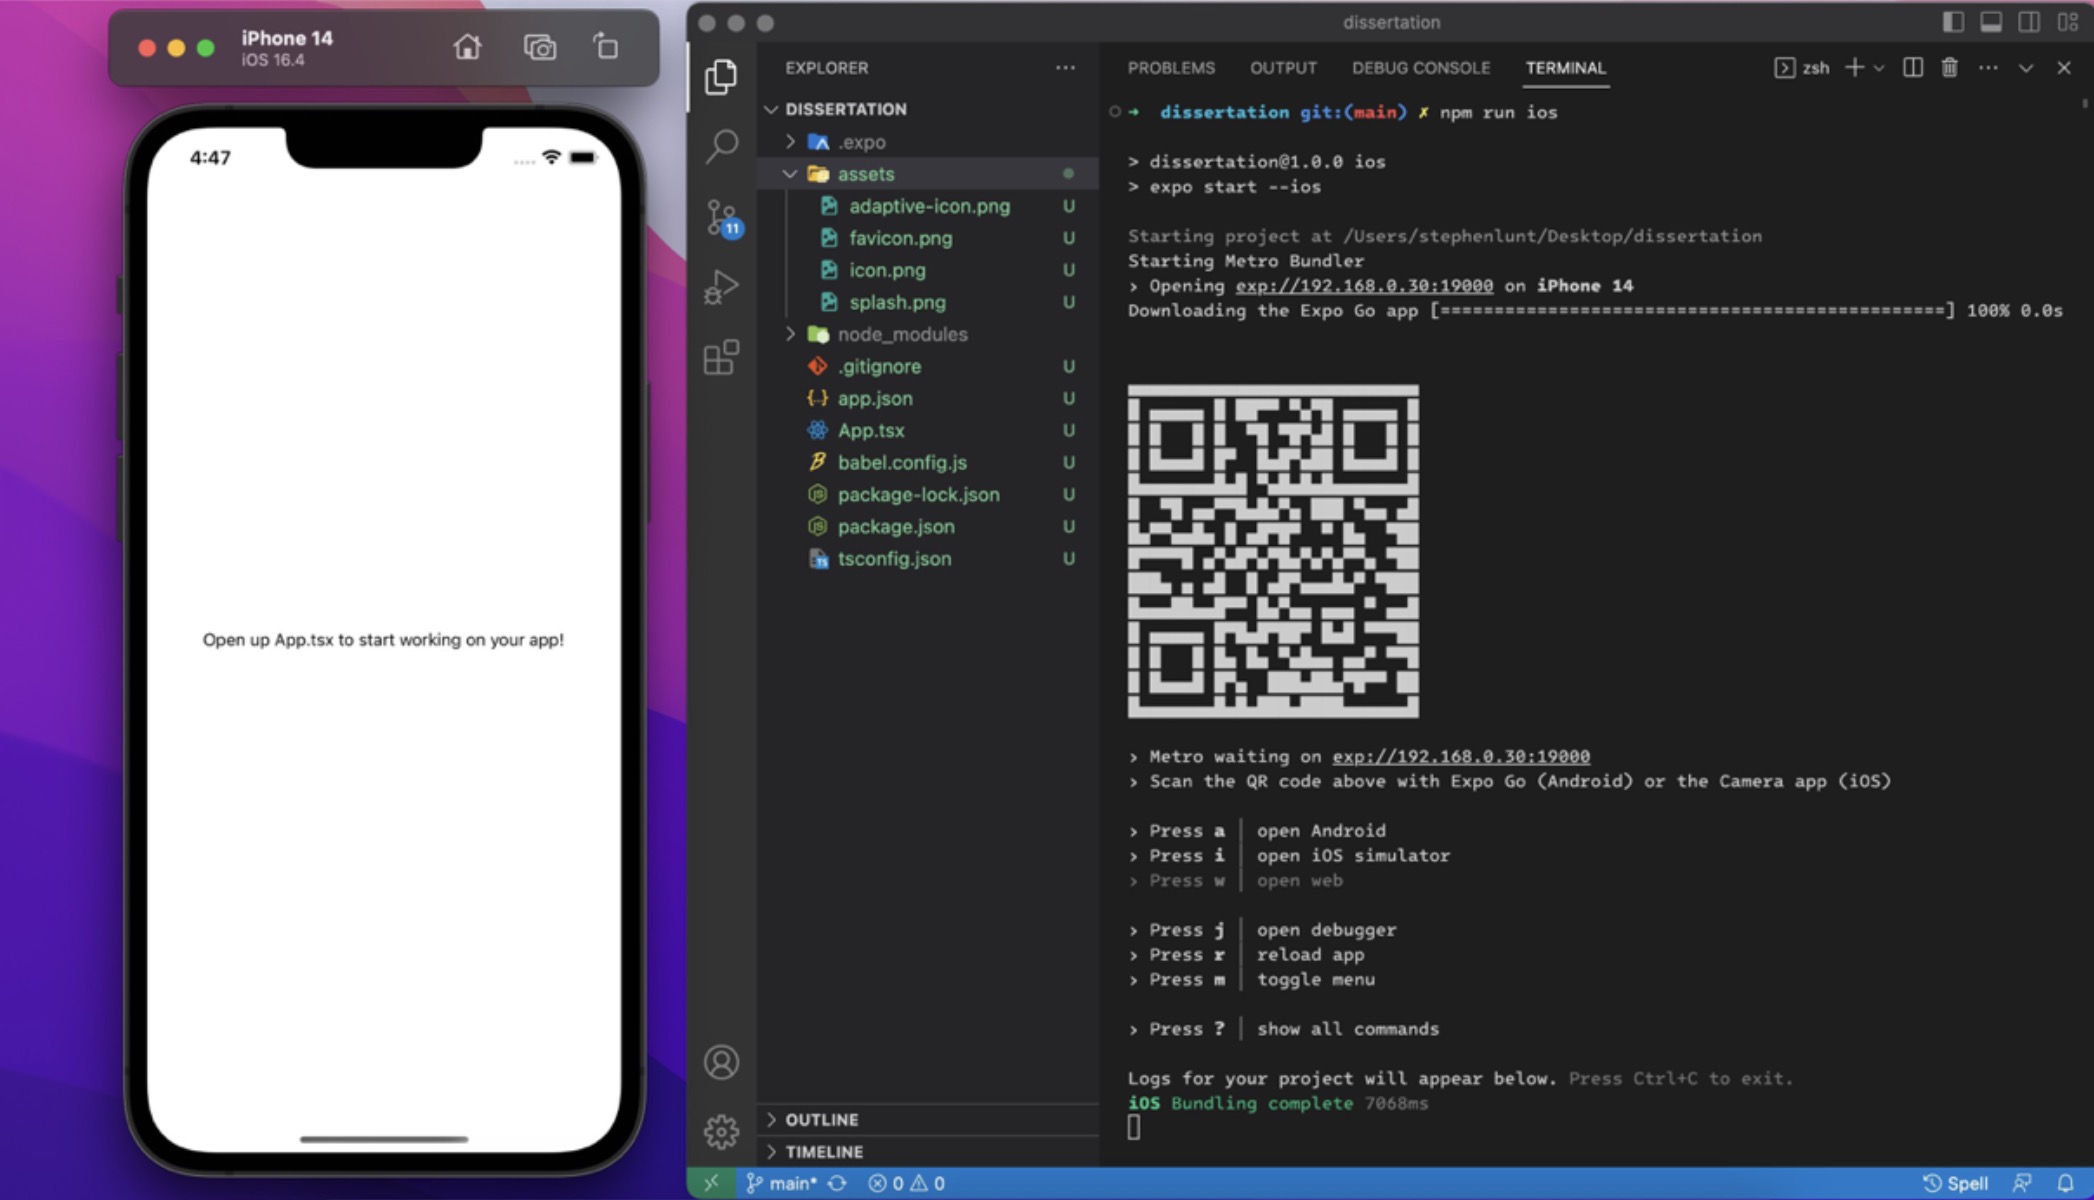
Figure 38 shows the result of this command including the boilerplate code and initial project structure that was generated. To ensure the project had been set up successfully at this stage, an iOS build was run using an iPhone 14 simulator on the MacOS operating system.
Figure 38: Screenshot of initialised project.
3.6.2 Project File Structure
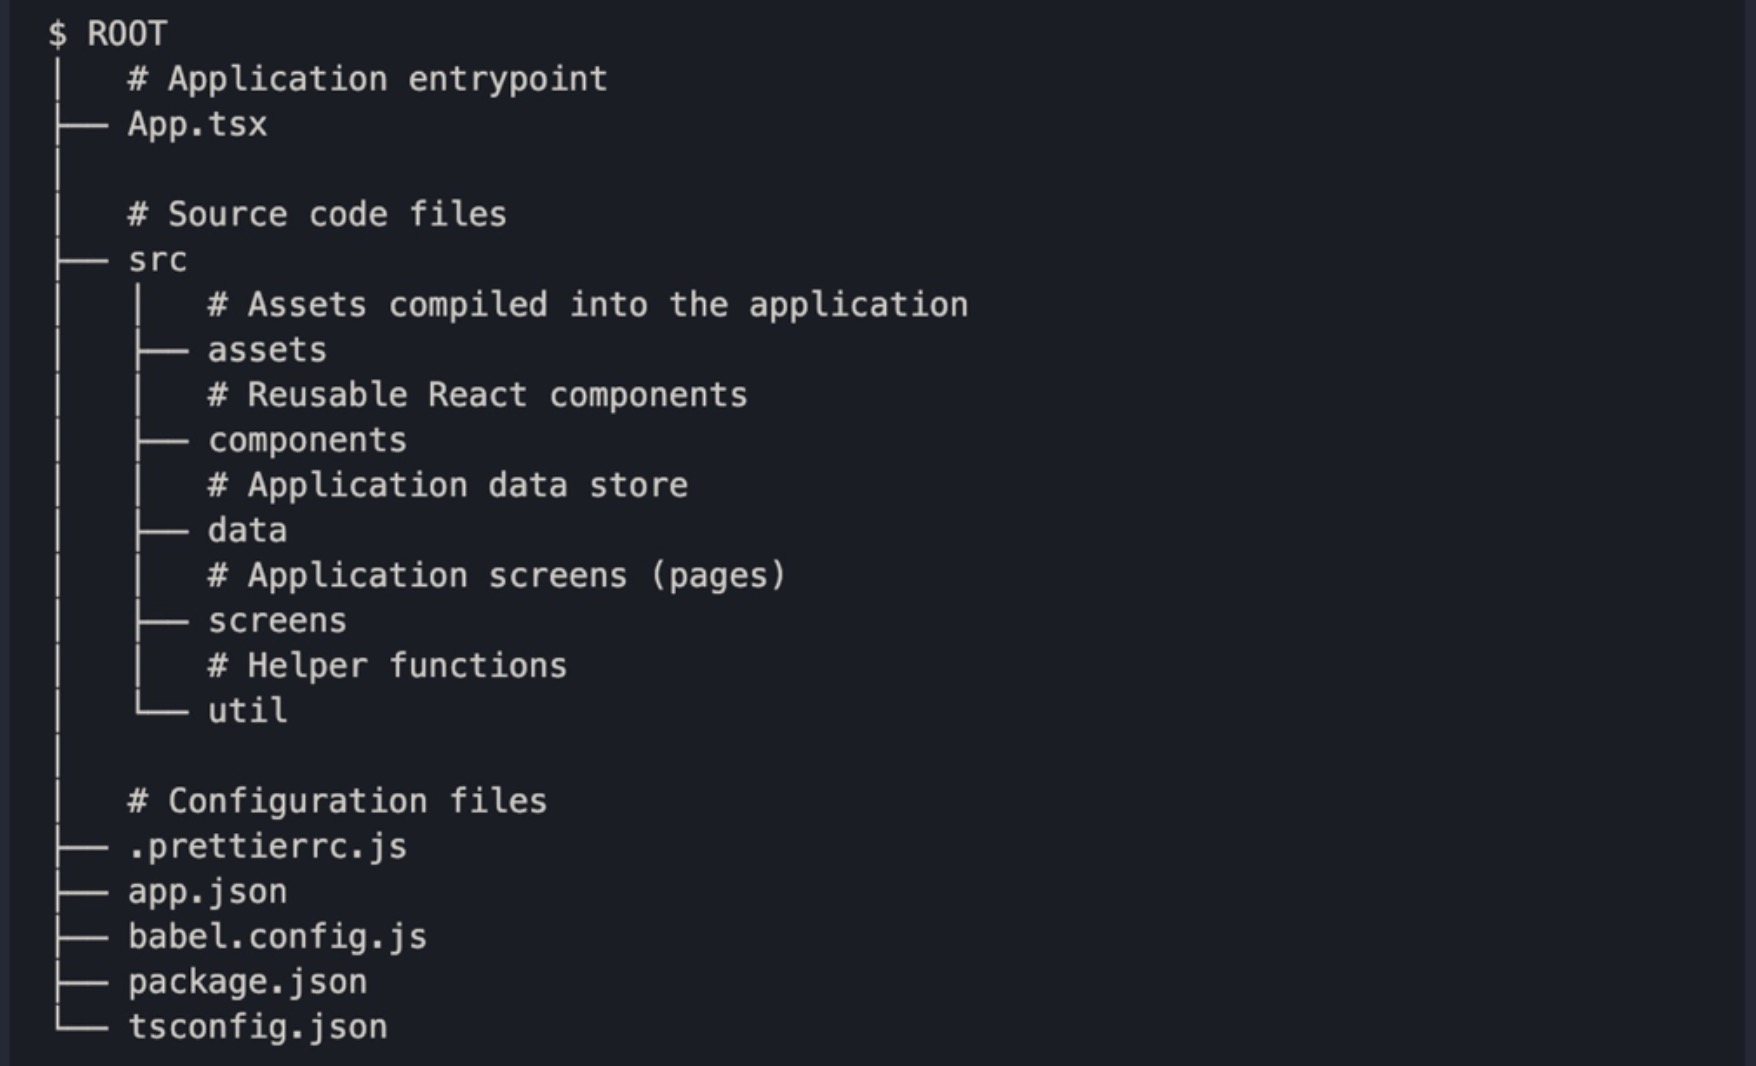
The screen capture in Figure 39 illustrates the chosen project structure which was created. It follows a common approach in React development whereby similar file types are grouped. For example, all the application screens are contained within one directory.
Figure 39: Screenshot of project structure represented in the README.md file.
3.6.3 Project Dependencies
React Navigation (2023a) and Native Base (n.d.) were the two initial dependencies identified to be of use for this project. They were installed using the node package manager following their documentation referenced to by the citations above.
As the mobile application will contain multiple screens, a solution to navigate between them is required (this idea is commonly referred to as routing). React Navigation solves this problem by acting as a router to different components across the application and handling user click points, thus enabling interlinking from one screen to another.
Native Base is a component UI library built with React Native which enables developers to use pre-built components that are accessible, responsive, and come with default styling. The motivation for using a component library in this project is to build off work done by open-source developers to standardise UI elements for React Native, rather than reinventing this personally from scratch. This leads to a reduction in development time by providing an out-of-the-box solution to creating common components.
3.7 Implementation Detail
The contents of this section will cover the implementation detail of each of the sprints carried out during the project. It is arranged in chronological order from the first sprint to the last.
3.7.1 Sprint 1 – Navigation, Home Screen and Route Data
The first aim of sprint 1 was to create two screens, the home and bus route screen, which could be used to configure the React Navigation router. Secondly, basic data on the route (such as its bus number and name) would be set up to build out the home screen.
React Navigation’s documentation details how a “Stack Navigator” component can be used as a wrapper around the React Native application in the App.tsx file. This wrapper handles the state associated with routing and allows the developer to specify child components to render as separate screens (React Navigation, 2023b). Initially, this was configured to support two routes, the “Home” route which renders the React component exported from Home.tsx and the “Route” route which rendered Route.tsx. In later sprints, this would be expanded to support all screens needed in the application.
Additionally, the “Route” screen was configured to accept an id parameter which could then be accessed from within the component. This essentially allows for dynamic data to be passed through the link and thus helps meet NFR2. React Navigation’s (2022a) documentation details the TypeScript setup for this using a RootStackParamList type as seen in App.tsx which enables child components to access the parameter signatures associated with each application route.
One issue that became apparent after the setup of React Navigation is that a more suitable naming convention would be required to distinguish between a bus route and a navigational route. For example, variables and files named route or Route.tsx could be misleading to developers reading the code as its questionable if they refer to navigational routes or bus routes. As a result, a refactor was completed to rename bus-related files and variables to include the word “bus”, e.g., BusRoute.tsx instead of Route.tsx.
Next, the application theme was configured. React Navigation (2022b) and Native Base (2022) documentation detail the configuration file formats to achieve this. This primarily involved using React Navigation’s configuration to control the colour theme for the applications header and default background and text colours. Whereas Native Base’s configuration in theme.ts concerns defining primary and secondary colours and default font sizes which extend the default styling of Native Base’s UI elements.
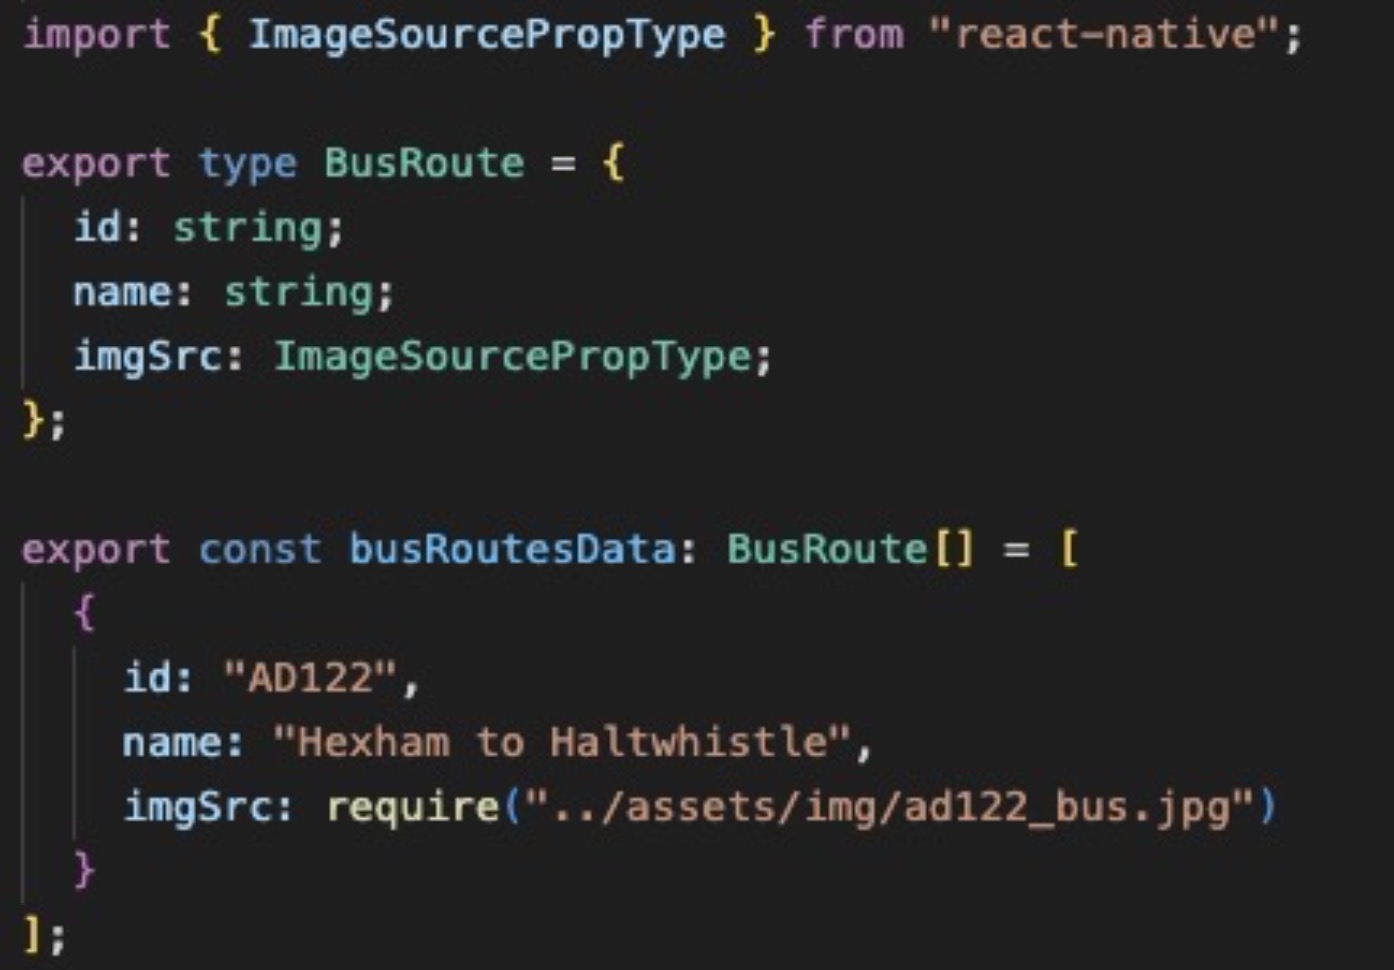
Finally, the first set of data was added to busRoutes.ts representing basic details of the AD122 route as seen in Figure 40. This mimics the solution for the data store discussed in section 3.4.4 and seen in Figure 36’s class diagram. The BusRoute TypeScript type represents the data structure of a bus route and the busRoutesData is a BusRoute array exported to be accessed in the React Native user interface.
Figure 40: Screenshot of the initial busRoutes.ts file.
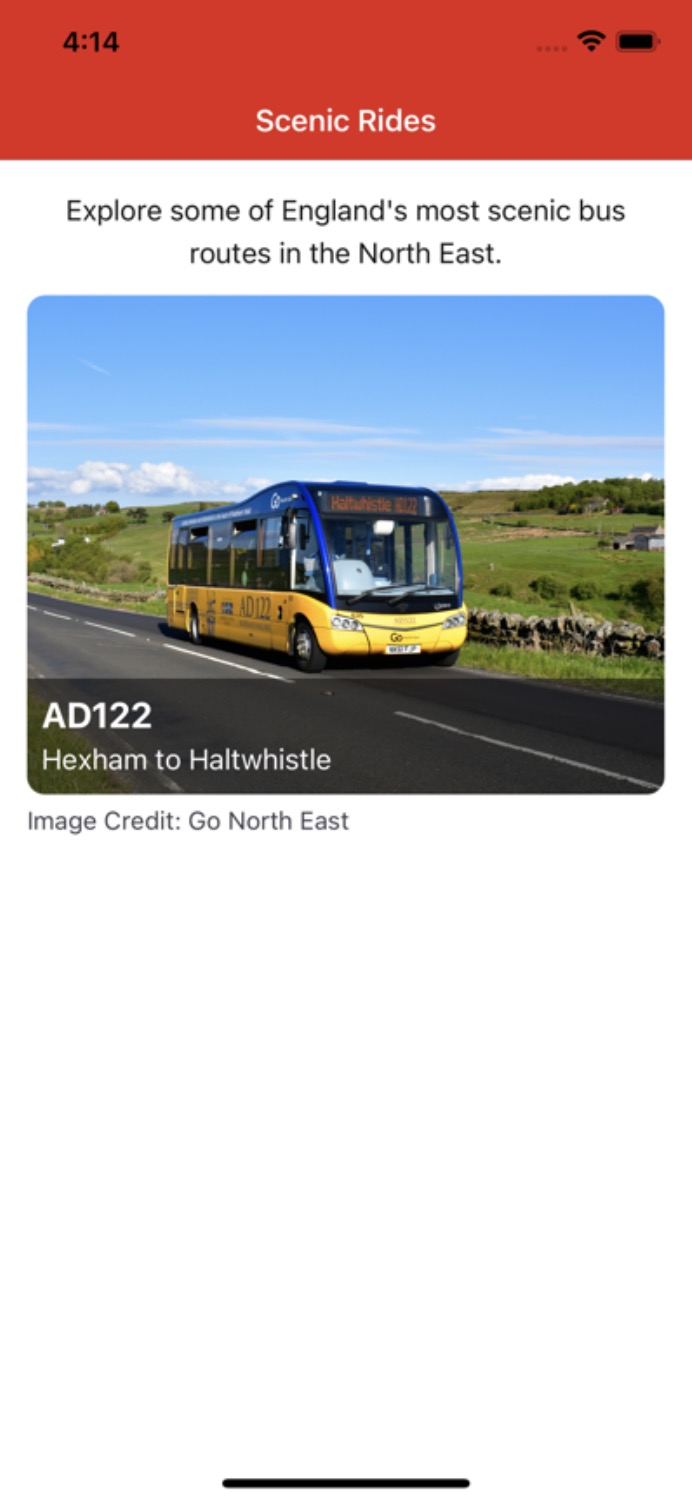
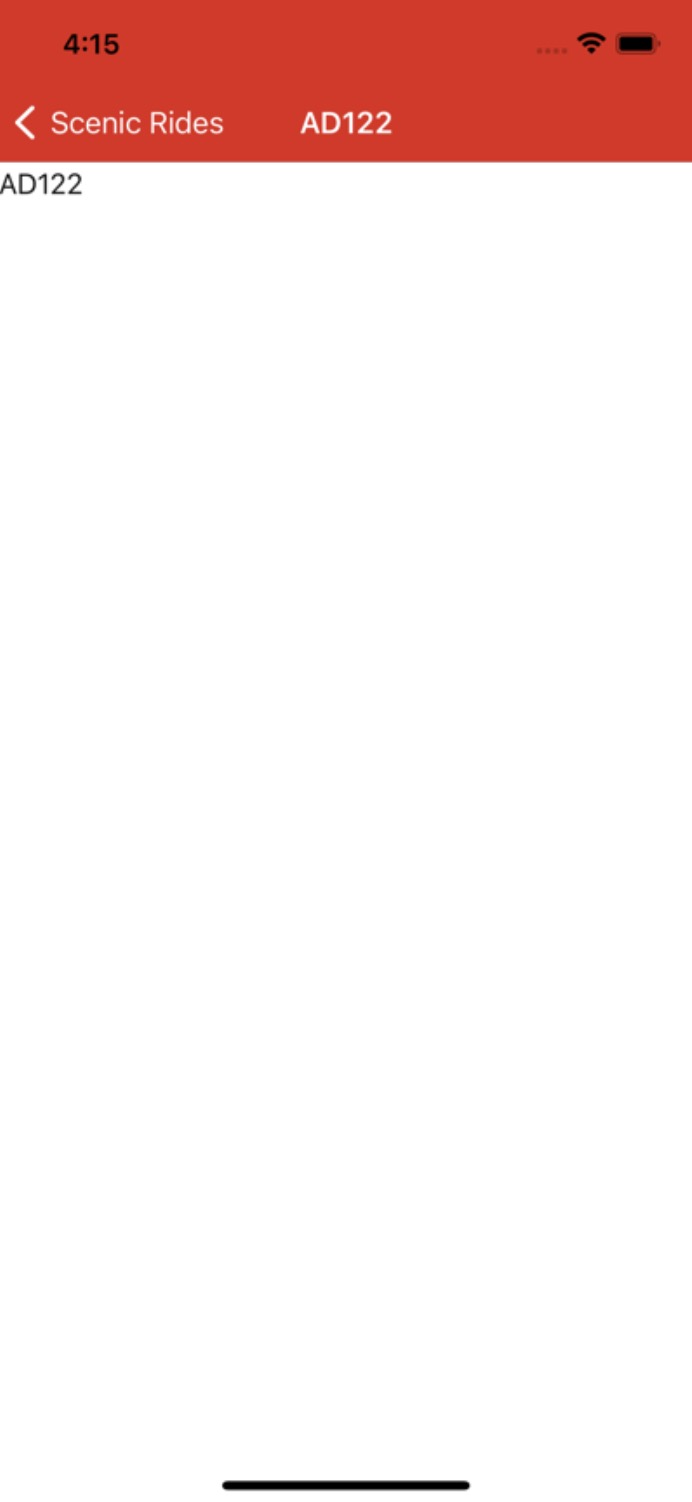
Following on, the user interface of the home screen was built using the basic details from the data file to display a clickable image which links to the route screen. This was then tested to ensure the bus route number was passed to the route screen from the navigator. The full results of this and other sprint 1 activities can be seen in Figures 41 & 42.
Figures 41 & 42: Screenshots of the application at the end of sprint 1.
3.7.2 Sprint 2 – Collecting Route Data and Mapping Configuration
The focus of sprint 2 was collecting the data which would be required to build the guidebook screen. As seen from the class diagram of the data store in Figure 36, the three main types of data to be collected are on bus stops, attractions, and points along the bus route. The most important piece of data at this stage was coordinate points that would be combined with the user’s geolocation so the application can calculate where the user is along the route and what is nearby to them.
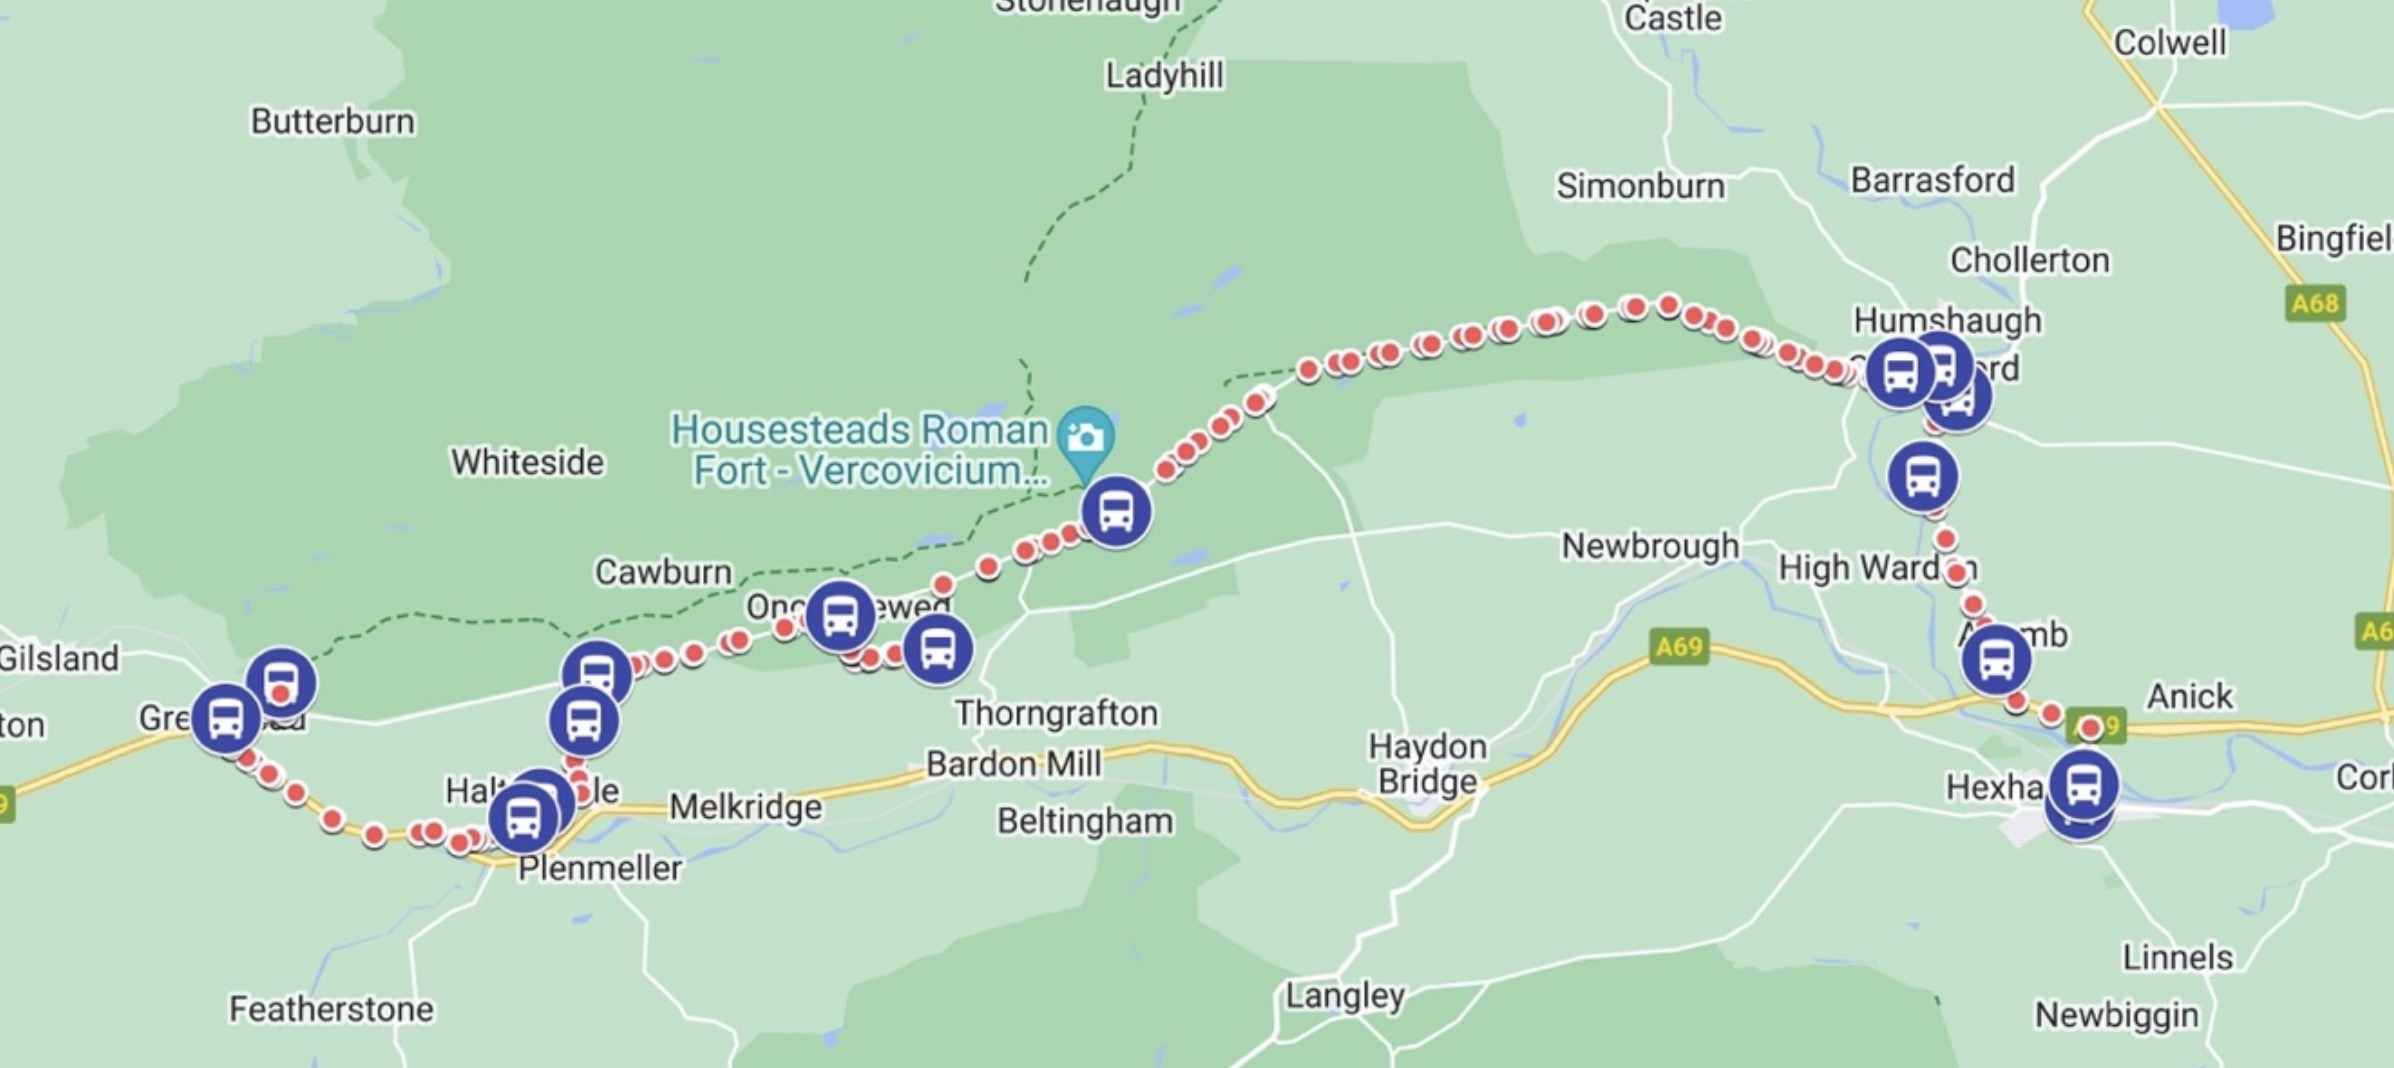
The first data collected was longitude and latitude coordinates to map the bus route. This involved undertaking a field trip to ride the AD122 in person to collect the data first-hand. Using Avenza Systems’ (2023) mobile application it was possible to record the positions the bus visited throughout its journey with GPS tracking. Afterwards, the data was exported in a CSV format which could then be analysed and used in our guidebook application.
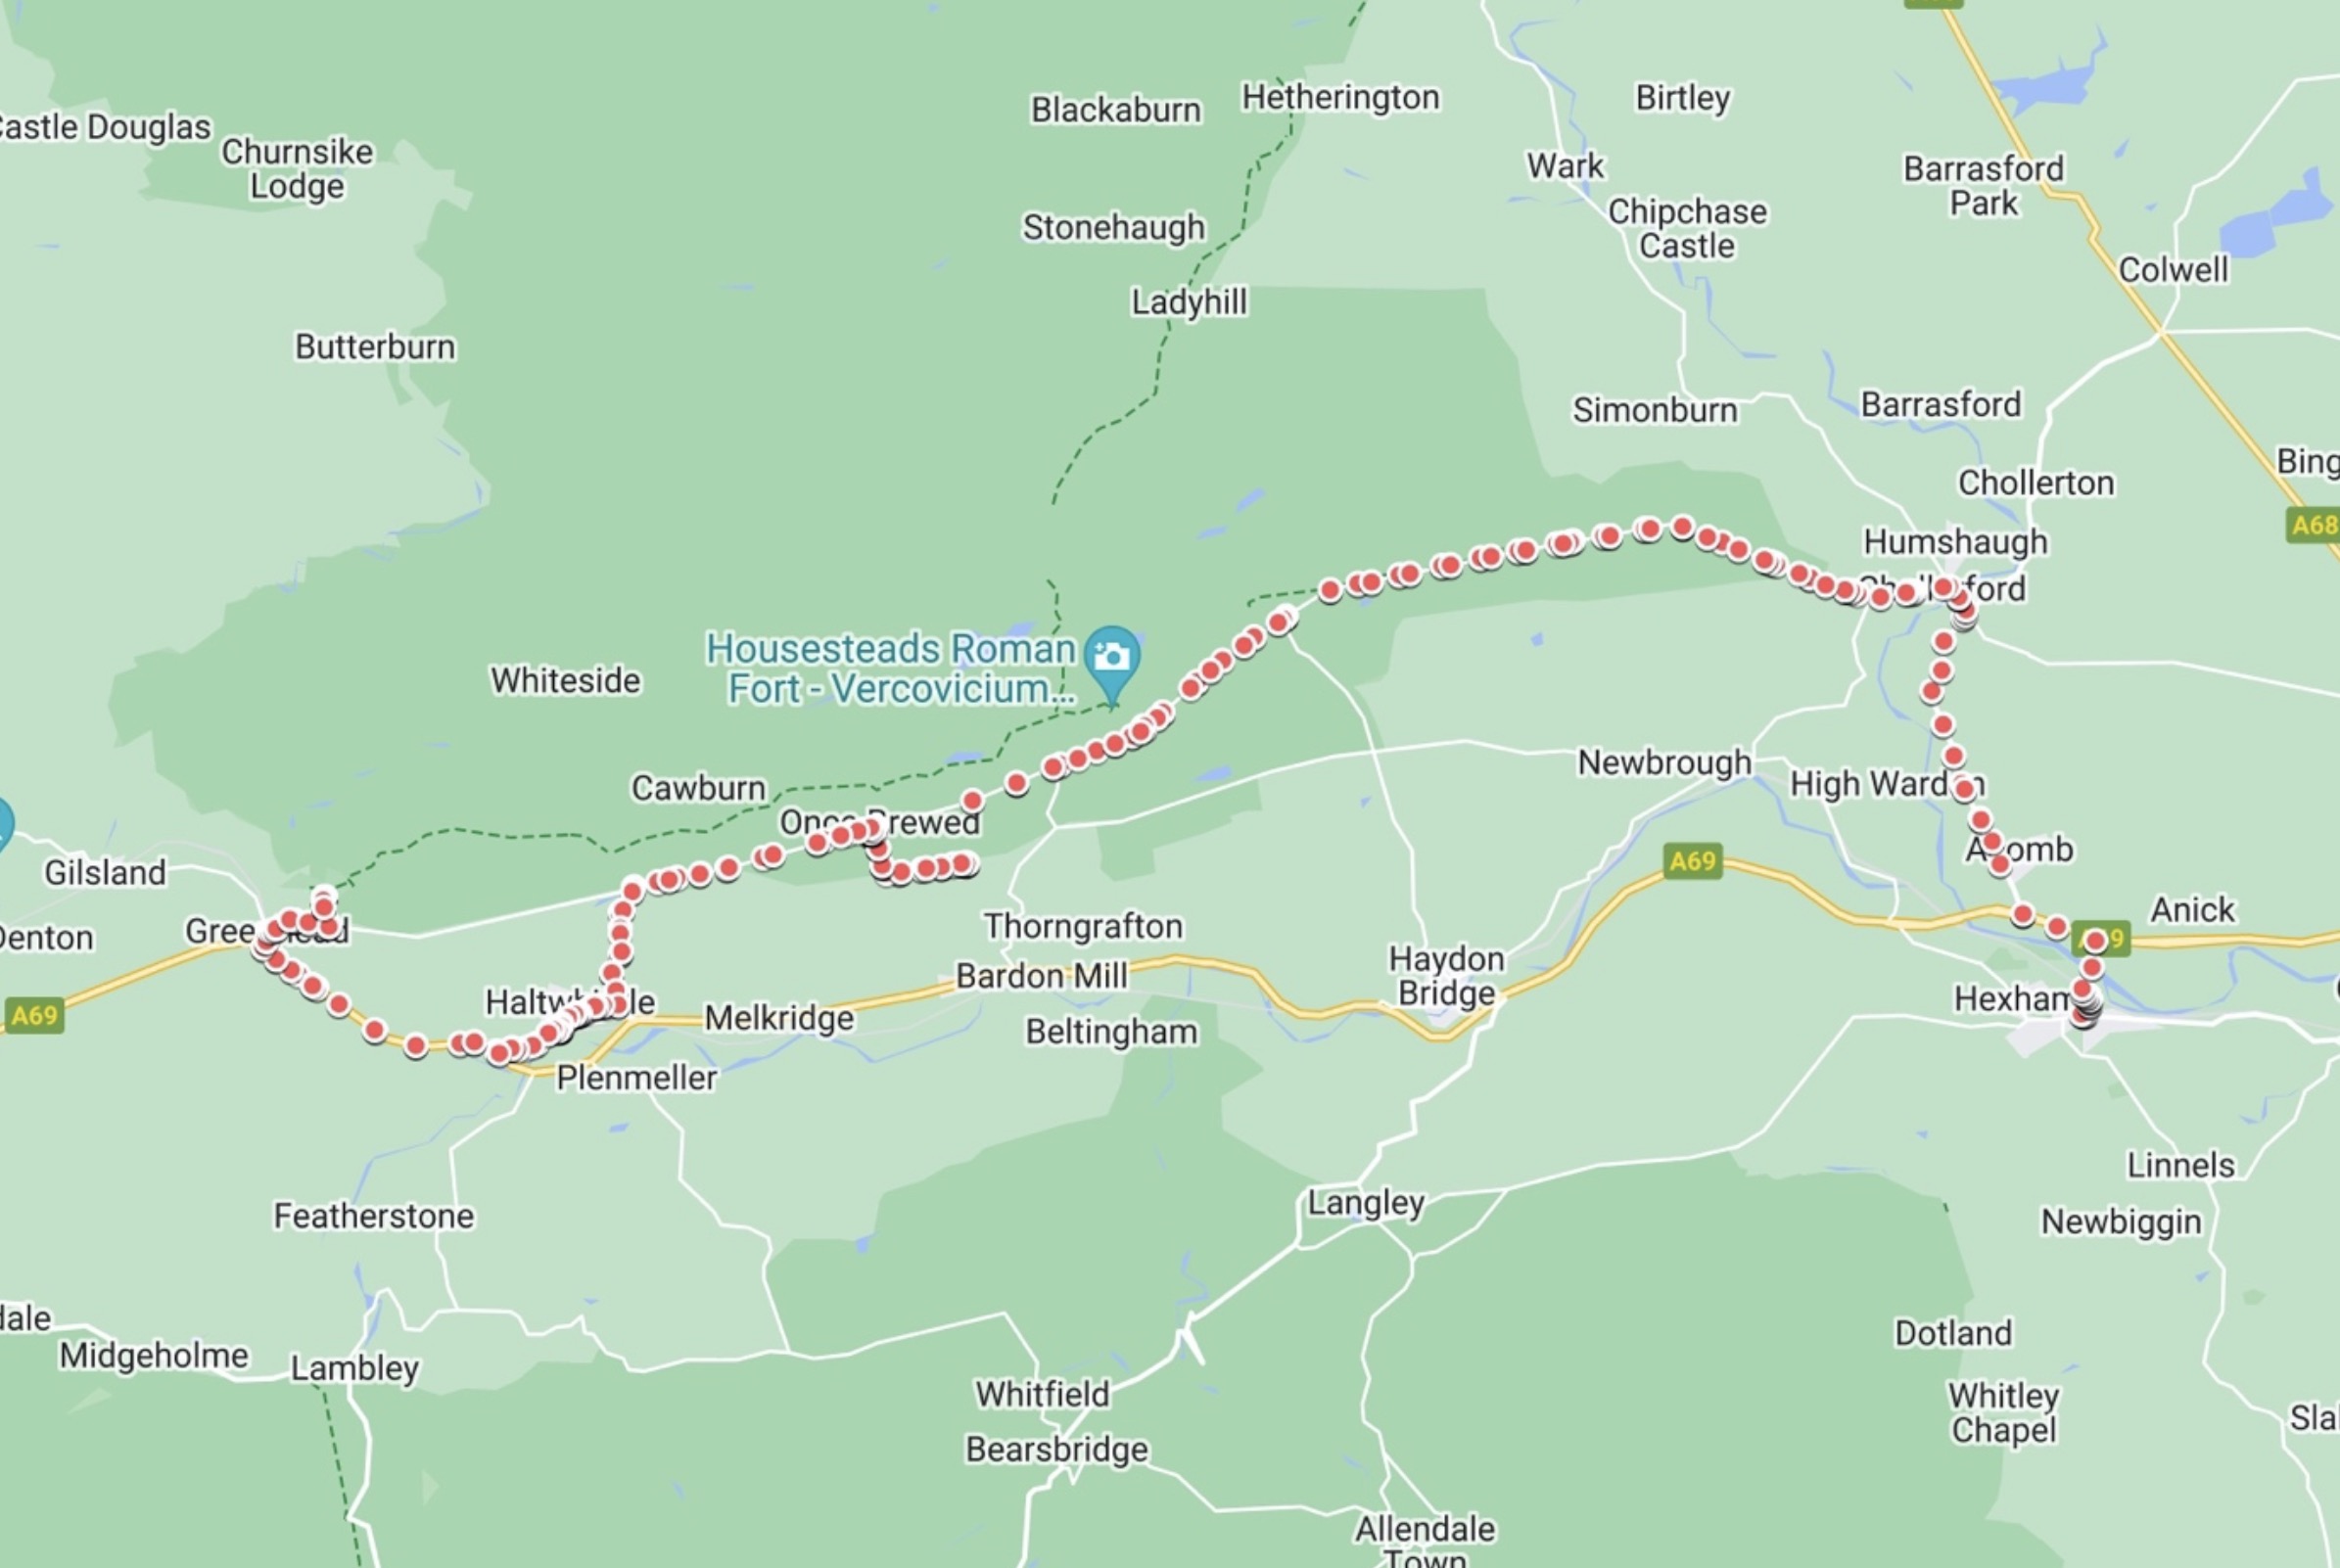
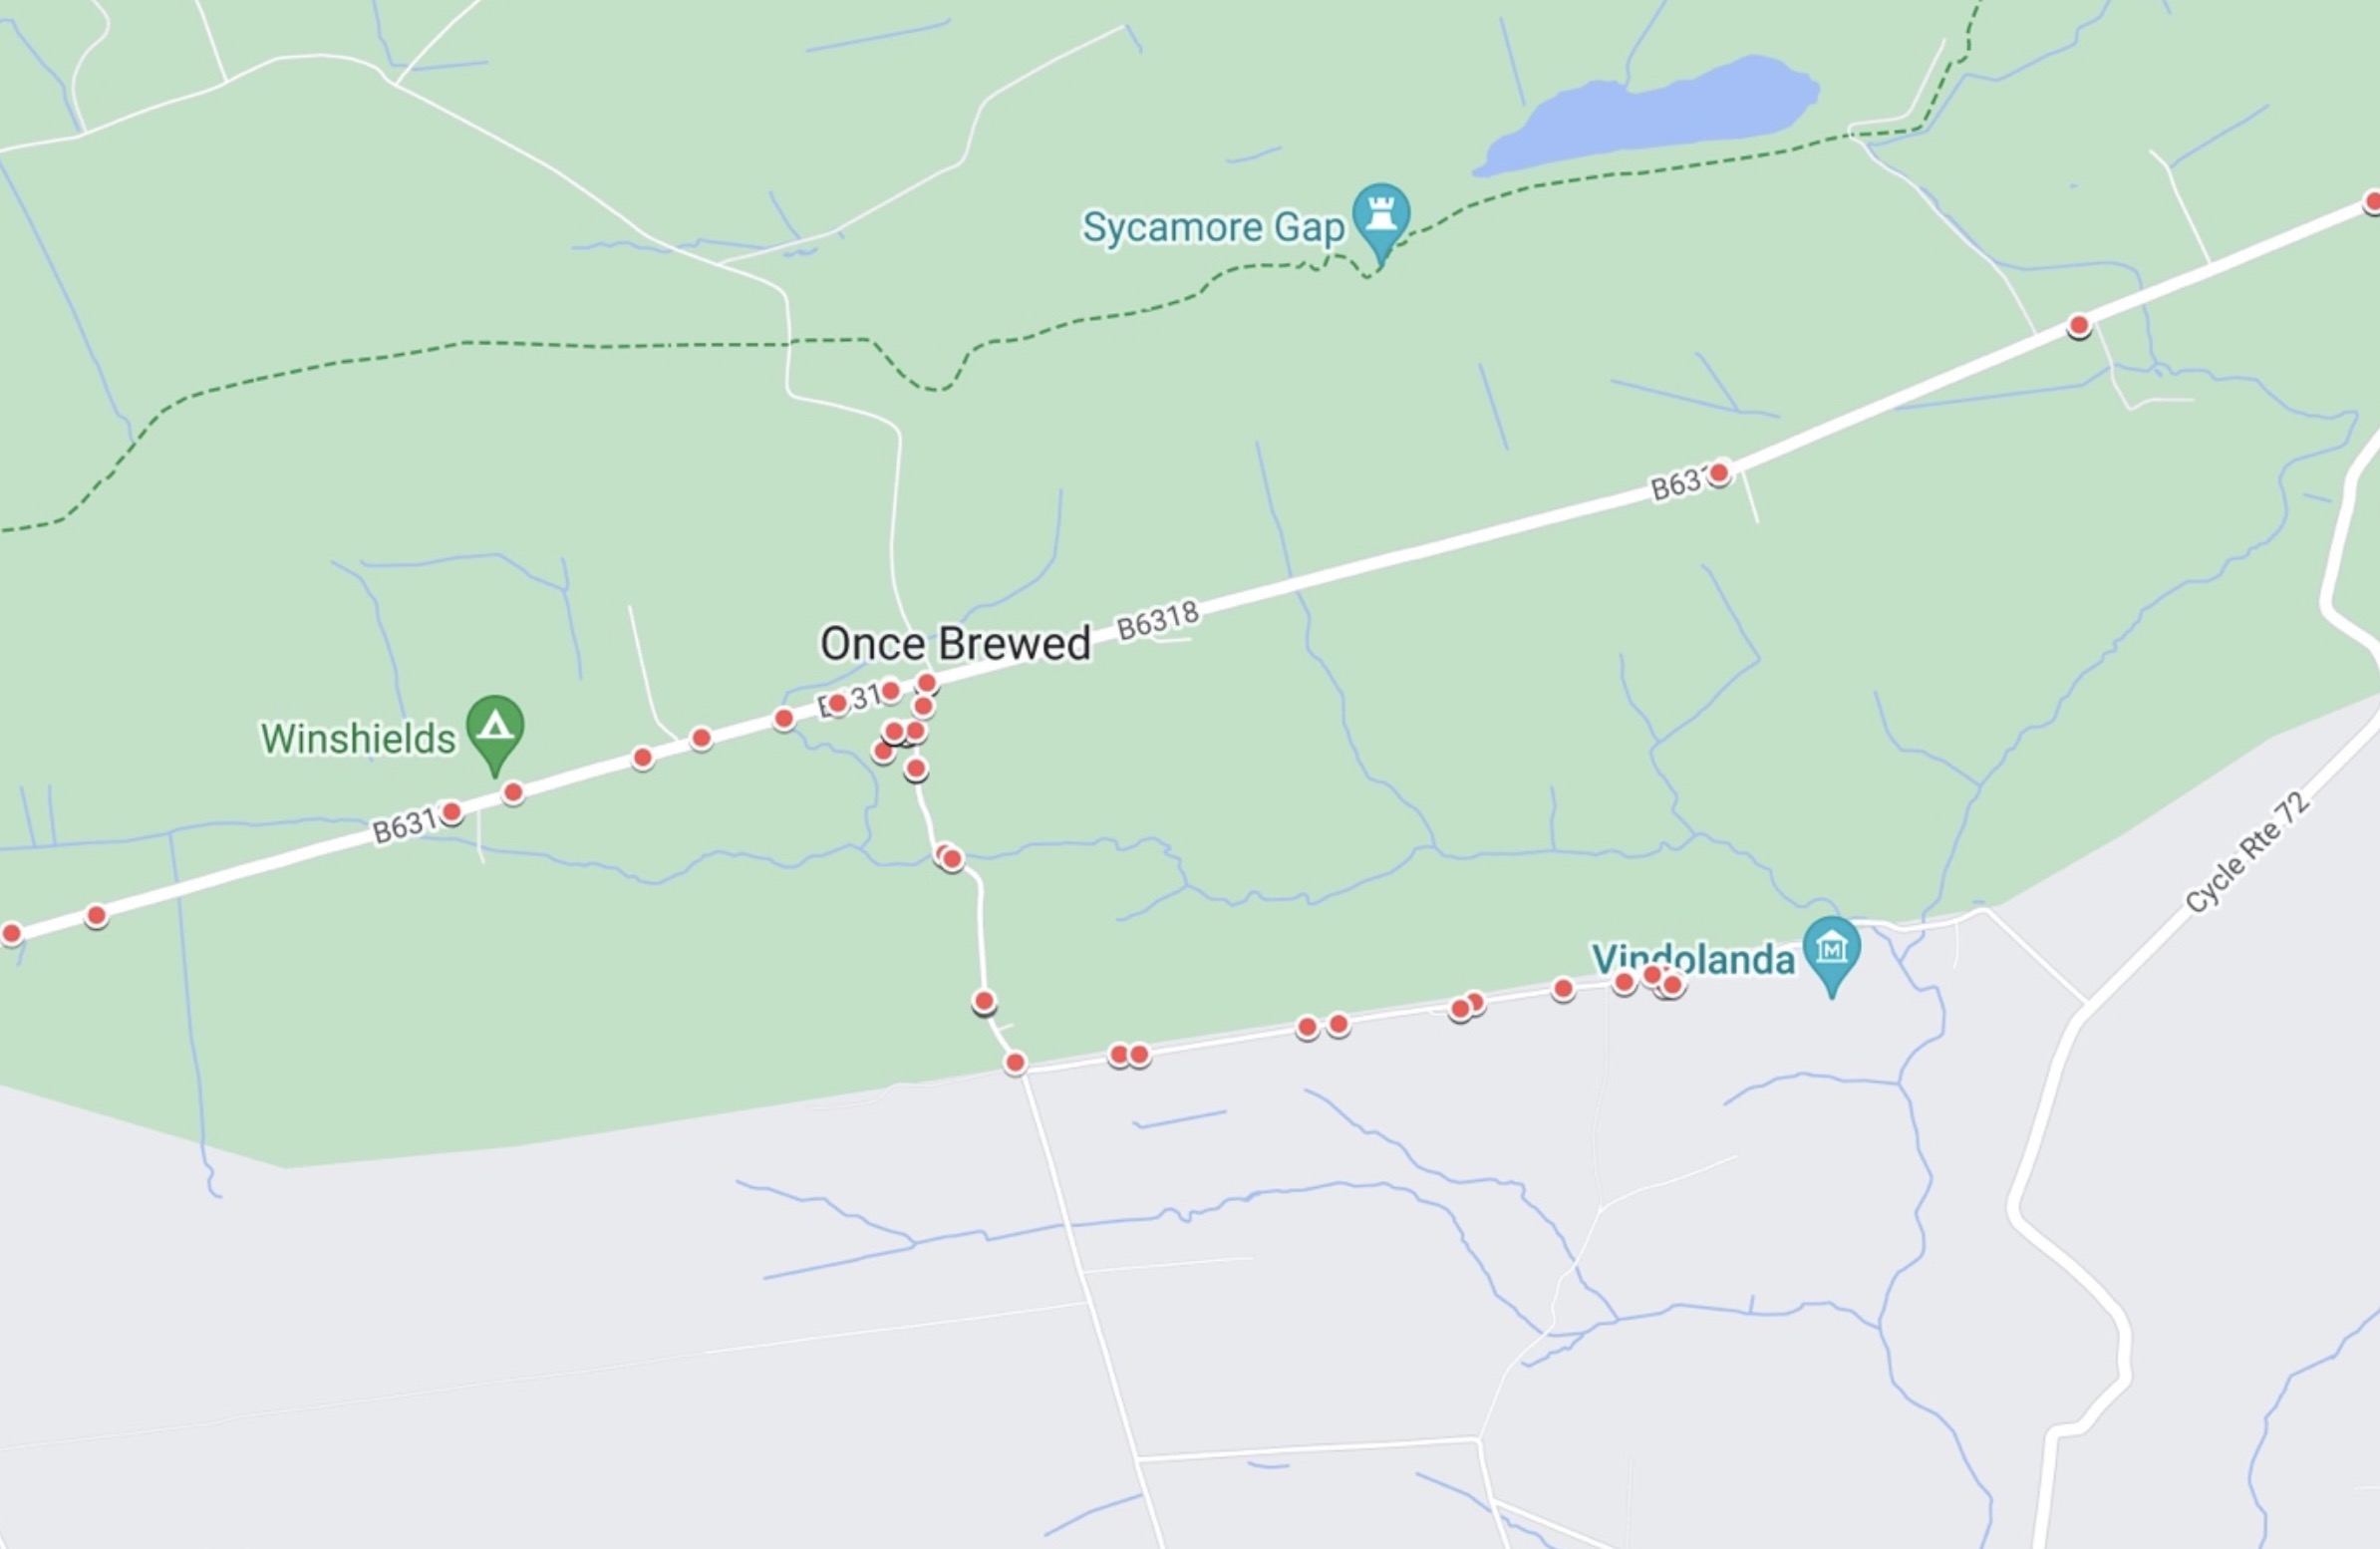
GPS coordinates are difficult to analyse without a visual reference, therefore the Google My Maps (n.d.) platform was used as a visualisation tool for this task. Google Earth Outreach (n.d.) provides a detailed guide for importing data to Google My Maps in bulk to be plotted onto a satellite map. The results of this are seen in Figure 43 showing the path between Hexham and Haltwhistle that the AD122 takes.
Figure 43: Screenshot of bus route data imported into Google My Maps.
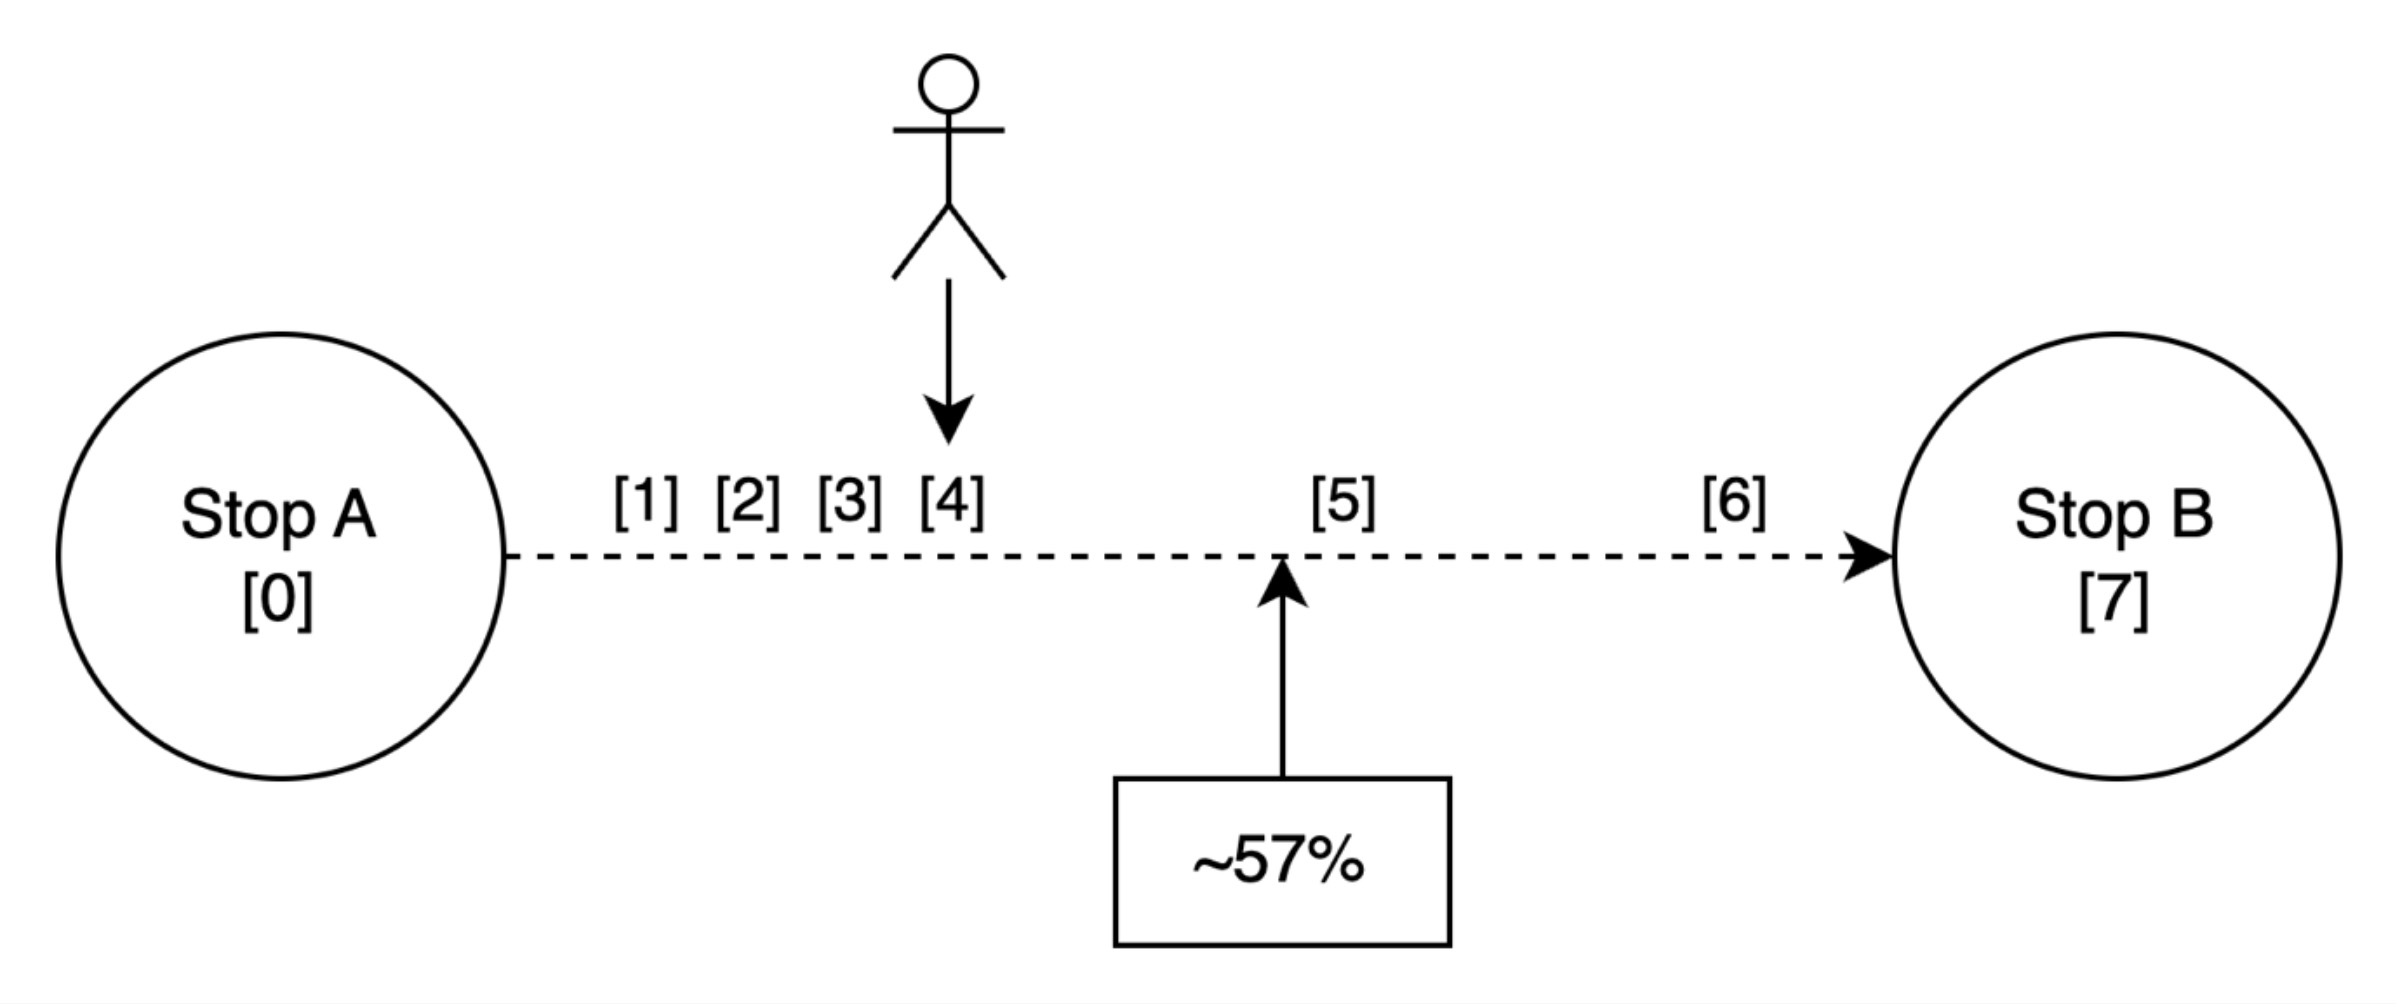
The motivation for collecting detailed data on route points was to prevent issues that might arise from using less precise information, such as only the coordinates of bus stops. Per FR5 and NFR3, the application must calculate the nearest bus stop and attraction to the user’s geolocation. In reality, there are additional complications involved with this requirement that must be thought through. For example, if the bus had just left stop A and was heading towards stop B, the nearest stop could be worked out by calculating the distance to both A and B from the user’s geolocation and taking the lowest value. However, even if the bus is closer to A than B, A would always be logically incorrect in this scenario. This is because the bus is heading away from A, therefore the closest stop on the route factoring in the direction of travel should be B. This specific scenario is illustrated in Figure 44 whereby A is incorrectly identified as the nearest stop based on distance away alone.
Figure 44: Diagram illustrating nearest stop problem.
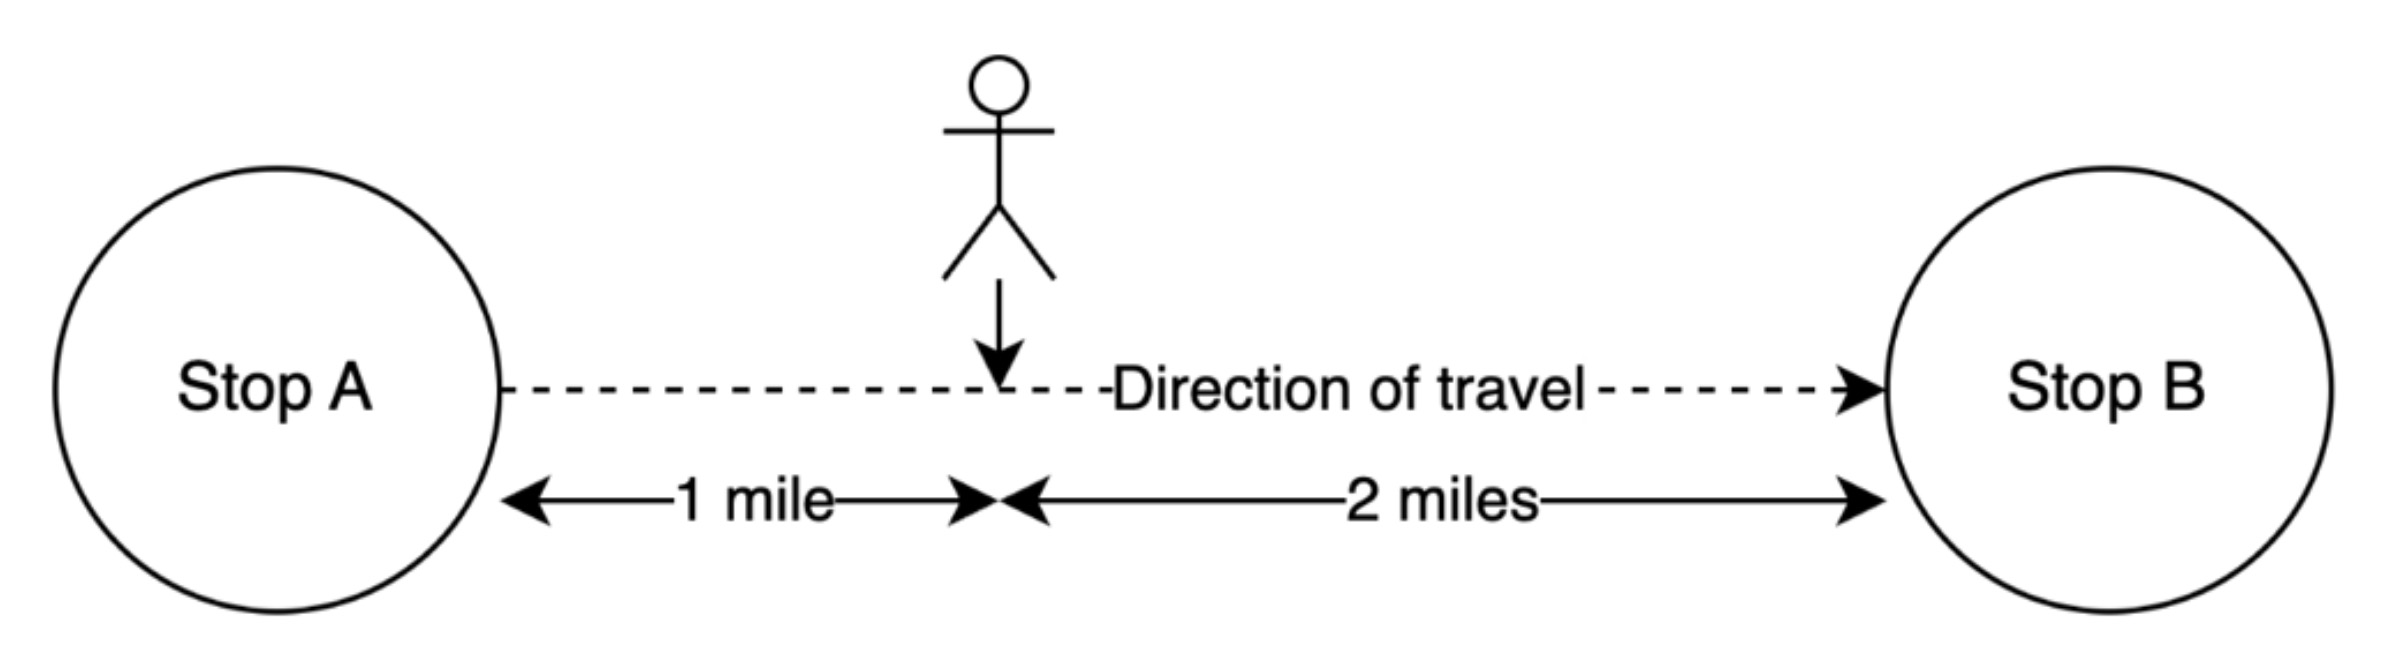
In the real world, this situation becomes even more complex should you factor in the many more stops along the route all at varying distances apart and geography, as roads are rarely a straight line.
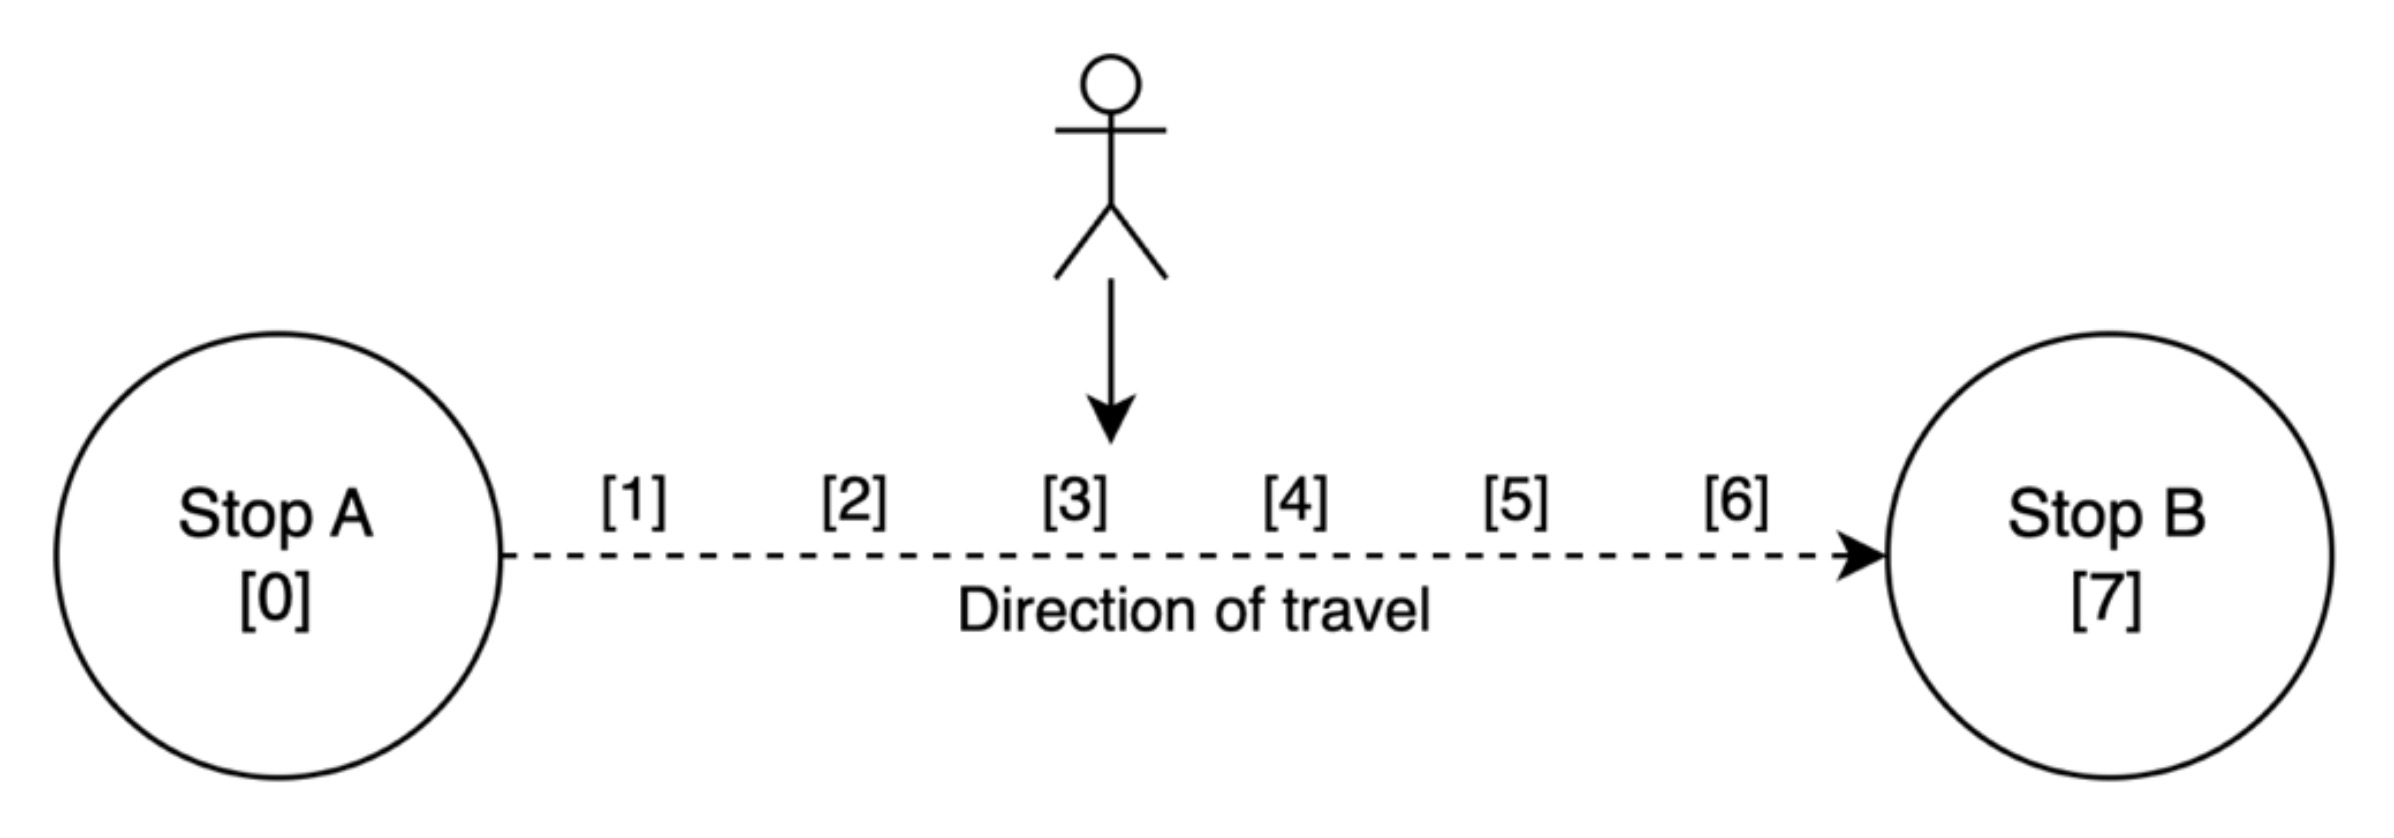
By introducing intermediate points between stops on the route the application will be able to more accurately predict where the user currently is located and where they are heading. This is illustrated in Figure 45 where points along the route are given a sequence number (represented by square brackets). The closest point to stop A is 0 and the closest point to B is 7. Therefore, if the closest point to the user’s geolocation is 3, the application can find out if the user is between stops A and B using comparison logic (e.g., 0 <= 3 <= 7). Combined with the direction of travel, the application can now correctly identify stop B as the next stop on the bus route. Furthermore, this logic can be reversed depending on if the bus is heading outbound or inbound. Please note that at this stage the discussion is only surrounding data requirements. Forthcoming sprints will discuss the writing of a correct algorithm to solve this problem using the data collected.
Figure 45: Diagram illustrating nearest stop solution.
Next, the positions of bus stops were plotted as an additional layer in the Google My Maps platform. This data was sourced by combining the names of all major stops from the official timetable provided by Go North East (2023) and existing bus stop markers in Google My Maps to get the coordinate points. This map layer is visible in Figure 46.
Figure 46: Screenshot showing the bus stop data plotted in Google My Maps.
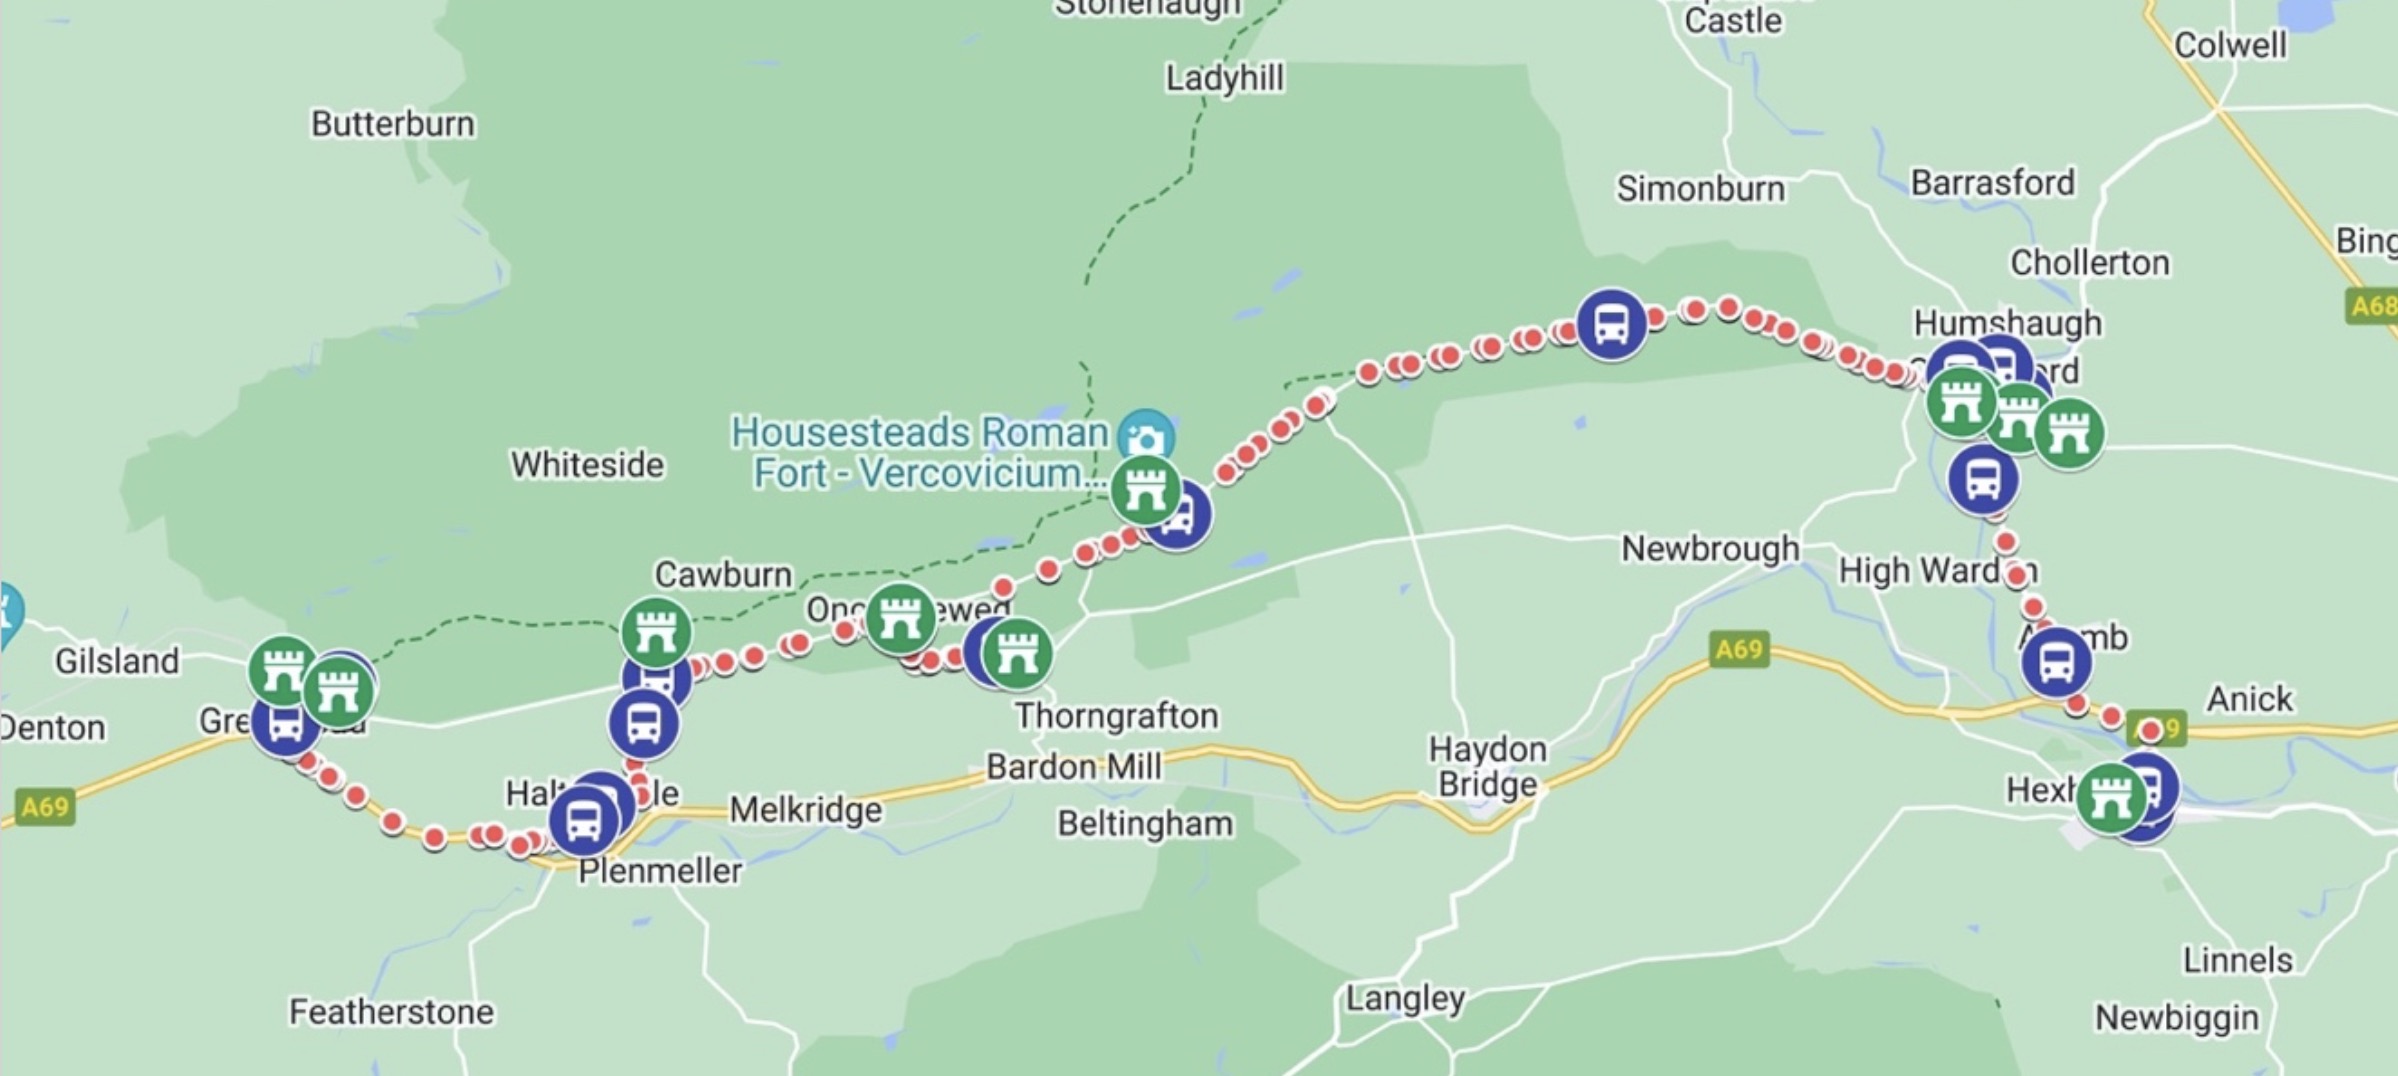
Finally, utilising existing attraction markers on Google My Maps, the points of nearby attractions could be plotted as seen in Figure 47.
Figure 47: Screenshot showing the attractions plotted in Google My Maps.
Following the collection of this data, a problem with clustering of the route points was identified which would be required to be fixed. The Avenza Systems (2023) mobile application used to track the route recorded points at a set time interval (e.g., every 30 seconds). Therefore, there was a higher density of points where the bus had slowed down and wider spread points where the bus was going faster (as seen in Figure 48).
Figure 48: Screenshot of clustering issue from a section of the route.
This was problematic as this data would be used for the vertical scroll bar illustrated in Figure 25 of the digital mock-ups. To achieve the desired visual effect a percentage completion of the route would be calculated by counting how many points had been passed versus the total points on the route. From this calculation, the scroll bar would update based on how much of the route has been travelled. The clustering of points would lead to inaccuracies in this calculation as it will distort the figure depending on where the points are clustered, causing the scroll bar to be improperly positioned.
This is illustrated in Figure 49 through a simplified diagram, whereby the user is at point 4 which represents circa 57% of the route travelled if divided evenly by 7 total stops. However, it is clear the arrow pointing to 57% is much further along the route than the user’s actual location due to the clustering of points 1 – 4 skewing the calculation.
Figure 49: Diagram showing skewed progress bar calculation from clustering.
This issue could be solved in a variety of ways, however, to avoid a more complicated algorithmic approach later on it would be more ideal to start with accurate data points. Therefore, the coordinate points of the route were manually replotted with a focus on achieving an even distribution between each. The resulting final dataset of points is seen in Figure 50.
Figure 50: Screenshot of final dataset plotted in Google My Maps.
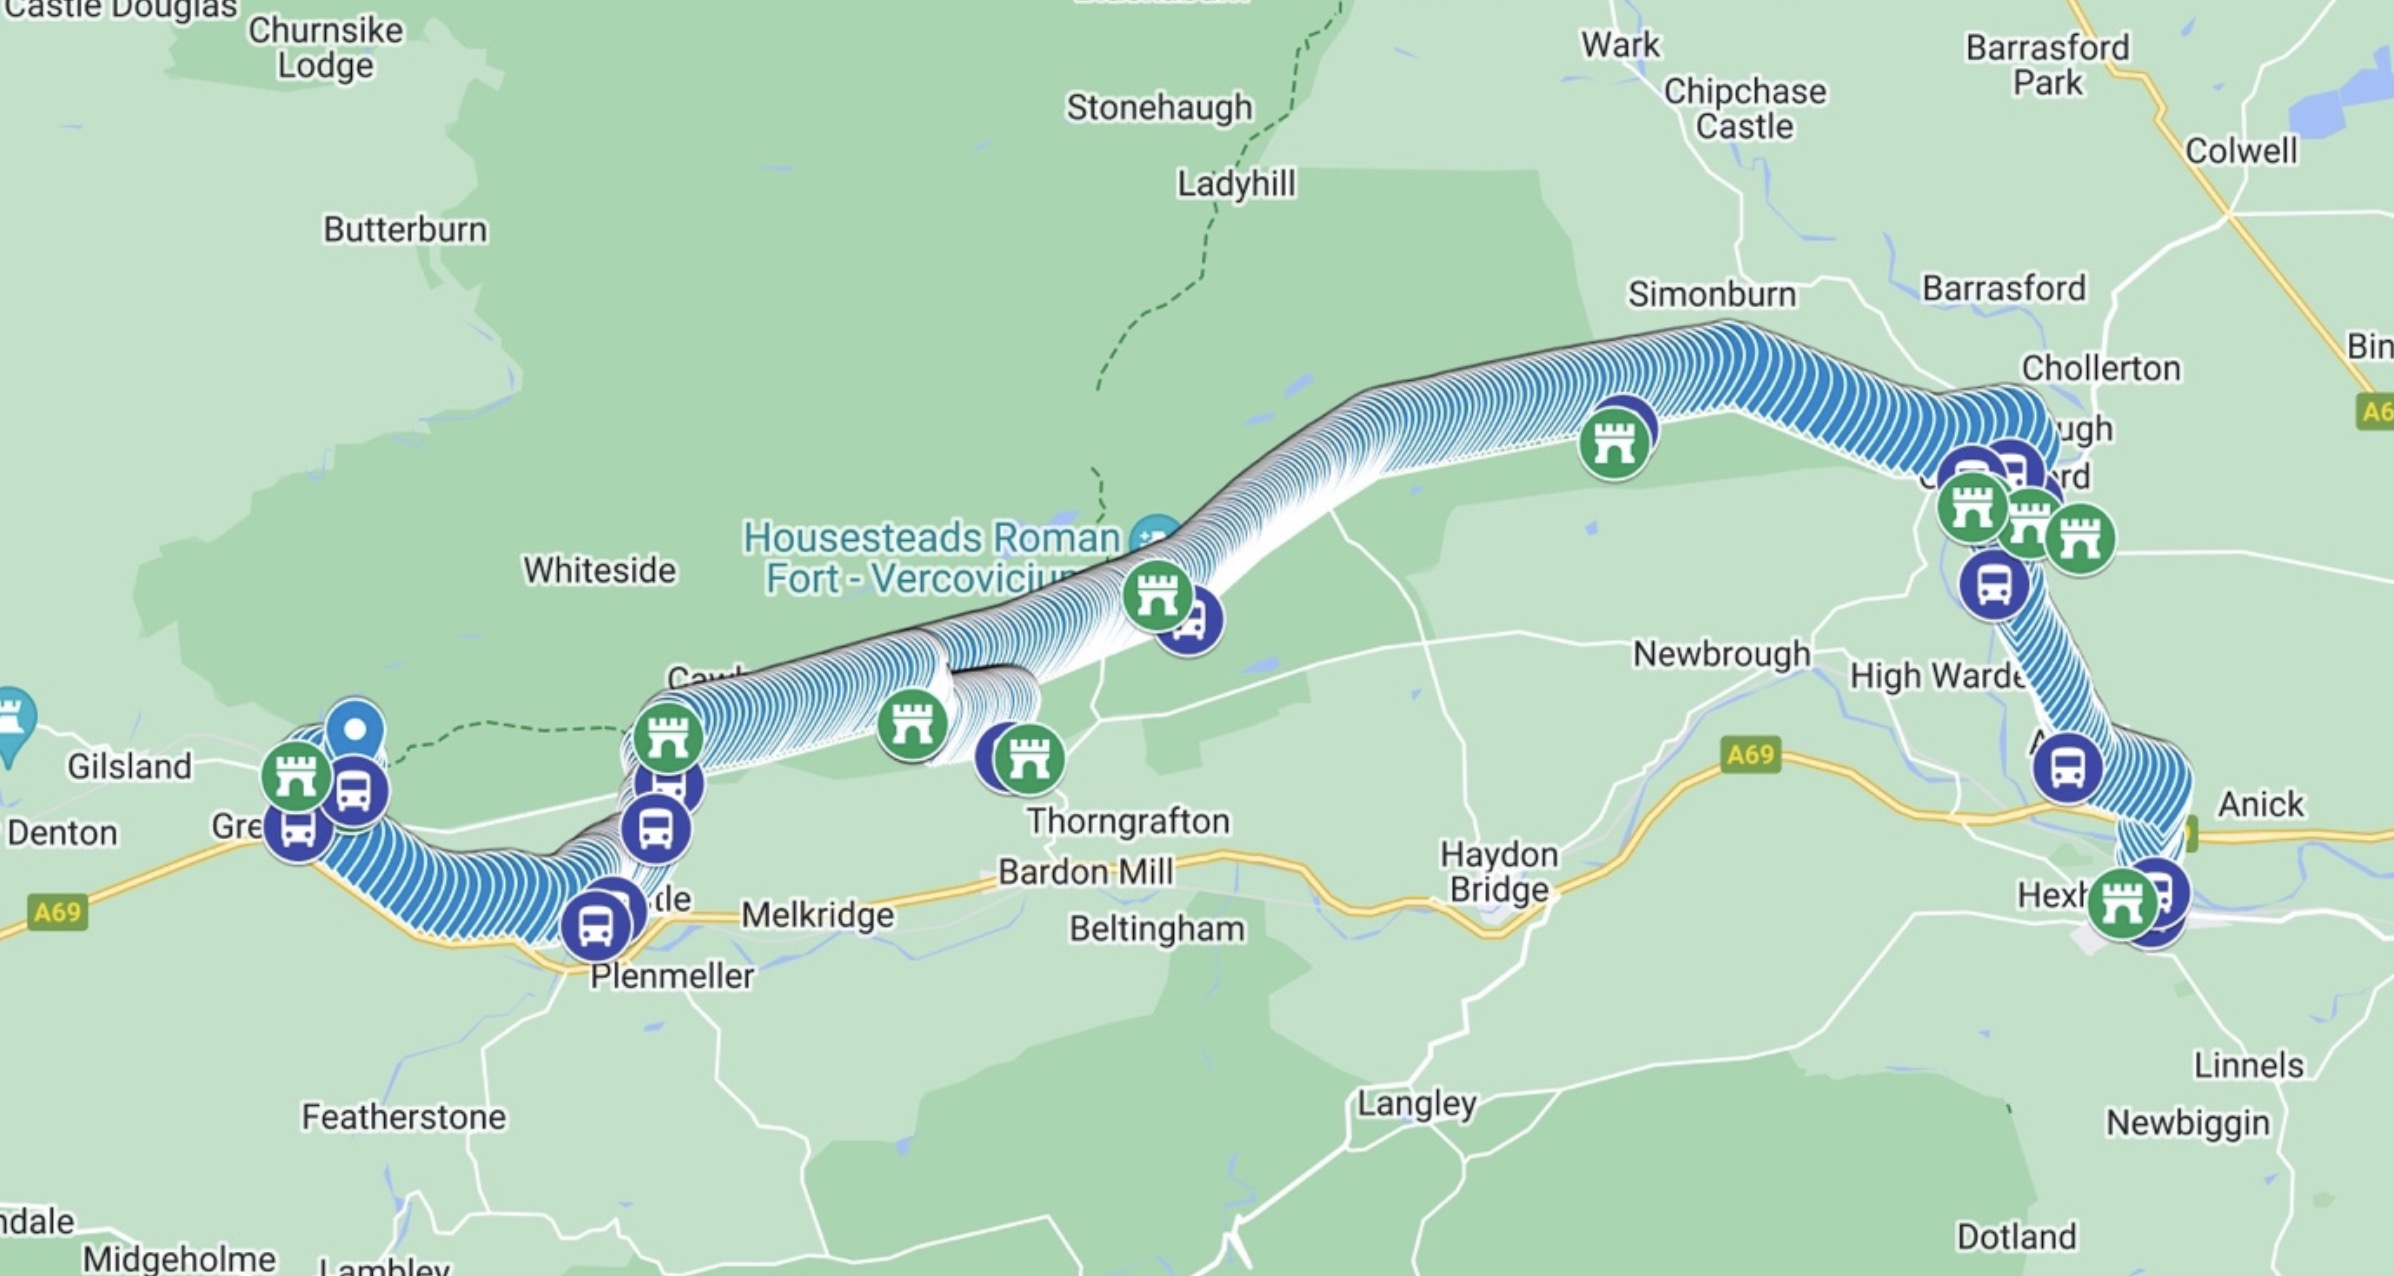
This mapping data now solves a two-fold case. Firstly, Google My Maps allows for each layer to be exported as CSV files which can be easily transformed into TypeScript files for the application data store. This formed the foundations for the files routePoints.ts, busStops.ts and attractions.ts. Secondly, zoomed sections of the map could be exported as images for each of the attractions. These images can be bundled as static assets in the mobile application, enabling a static map solution to be embedded with zero network usage. This resolves the problem discussed in the research section 2.4.1 and aids in meeting NFR4.
3.7.3 Sprint 3 – Bus Route and Guidebook User Interfaces
The target of sprint 3 was to build the user interfaces for the bus route and guidebook screens. This would focus primarily on visual design and page layouts during sprint 3, with most functional work being left to sprint 4.
The bus route screen aims to give users basic details on the route, such as a short description, its timetable, and a link to the bus operating company’s website should the user wish to find out more. Furthermore, it would feature a large call to action to view the routes guidebook.
To create the graphic for this call to action, Canva (n.d.) an online graphics design tool was used. The inspiration for the design came from printed fold-out guidebooks/leaflets which are commonly seen in the tourism industry. The intention of using a traditional design was to build off existing symbolisms and associations the users may have with guidebooks. Ideally, the user should have a good expectation of what content they will be greeted with when clicking on this link. Whereas a design focused on a mobile guidebook could be confusing to the user as they may not associate it with anything due to the low prevalence of mobile guidebooks available.
Additionally, to adhere to NFR2 in making the application expandable in the future, dynamic rendering of content was used. This meant the details of the route were set up in busRoutes.ts in the data directory, instead of being hard coded into the screen directly. This makes the screen a fully reusable component that will dynamically update based on the routeId parameter passed in through the React Navigation router.
The full results of this work on the bus route screen are seen in Figure 51.
Figure 51: A screenshot of the bus route screen.
Next, the guidebook screen was created which features two main components; a vertical progress bar and a scrollable list of stops and attractions. Before these could be built, the relevant data from the data store files needed to be imported and stored in the React component state to be accessed throughout the screen. This was achieved with the React useEffect and useState hooks, whereby the useEffect fires once when the screen renders to filter and set the component’s state.
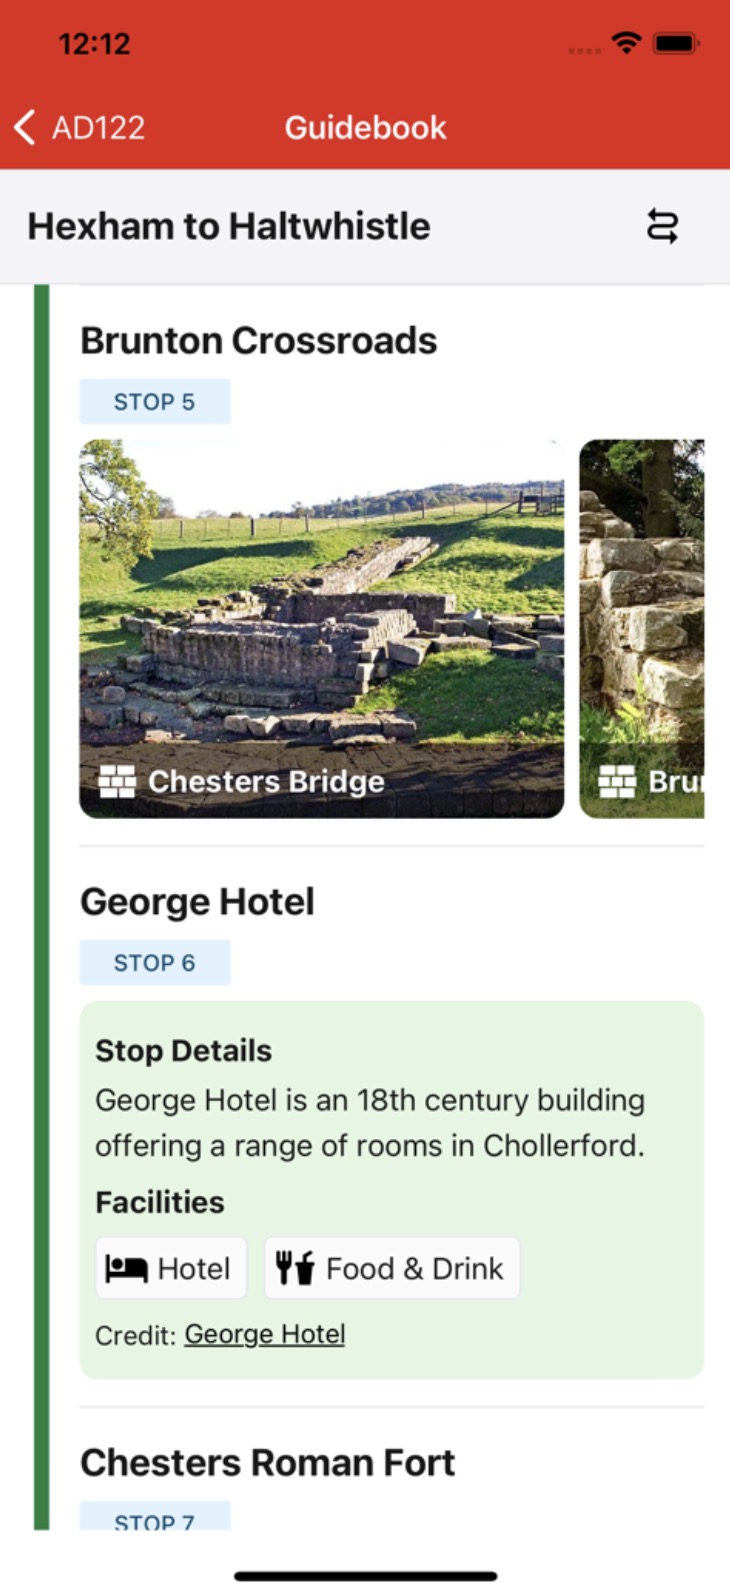
Following on, the component StopList was created in StopList.tsx. This component would loop over each bus stop on the route to create an ordered list of stops from origin to destination. Each stop would be represented as a box in the user interface which includes details on the stop and most importantly which attractions are nearby to it. A design decision was made at this stage of development that each stop would be a fixed height in the UI regardless of how many attractions it has. This aids the development of the progress bar component as each stop can be represented as a fixed percentage. For example, if there are 18 total stops on the route, as with the AD122, each stop represents ~5.55% of the route travelled.
The ProgressBar component was then created in ProgressBar.tsx. This would sit on the left hand side of the stop list in the UI to show how far along the user has travelled on the route in relation to nearby stops. The ProgressBar itself was created using relative and absolute CSS positioning. Firstly, a Native Base Box component (similar to that of a div in HTML) is given a grey background and a height of 100% meaning it will expand the full height of the stop list. Secondly, two inner components are layered above the grey bar using z-indexes which are the green progress bar and a bus icon. A prop percentage is passed to the component which represents the percentage of the route travelled. From this value, the green bar and bus icon dynamically adjust in height as the percentage changes. During this stage of development, many of the variables needed to calculate the route progress were static as this functionality had not yet been programmed. However, the percentage could be manually adjusted to test that the progress bar worked as intended. Figures 52 & 53 depict what these iterations of work on StopList and ProgressBar looked like at this point.
Figures 52 & 53: Screenshots of early progress on StopList and ProgressBar.
Additionally, as seen in the above figures, an option for the user to swap the direction of the travel was added to meet FR7. This was achieved by giving each stop in busStops.ts a unique sequence number. When the user clicks to swap the route direction, the order of stops is sorted on the sequence number and updated in React state triggering the UI to re-render.
With the main structure of the guidebook screen complete, it was possible to now build the UI for individual stops. Following the design from Figure 25 of the visual mock-ups, each attraction on the route would be a clickable picture which links to its attraction screen. Images for all attractions were sourced online and saved locally in the applications assets folder to be bundled with the application. Therefore, it would not be necessary to request the images over a network so the app can work offline. In the attractions.ts data file the images were imported which would make them available to access in StopList.tsx. The results of adding images to the stop list are seen in Figures 54 & 55.
Figures 54 & 55: Screenshots of the guidebook screen.

To account for the decision that each bus stop’s UI must be a fixed height, a React Native horizontal scrollable component was used for attraction images. This was set up so that if a stop has only one attraction, the image would expand to fill 100% of the available width. Whereas, if the stop has more than one attraction, images are sized slightly below 100% to show the user a peak of the next attraction, thus indicating they can scroll to it horizontally. This is seen in Figure 55 for the Brunton Crossroads stop. One difficulty encountered at this step was ensuring the height and width worked with the aspect ratio of the images to prevent images from being cut off or stretched. Using Native Base’s image component resizeMode=“cover” prop and finding an appropriate fixed height, this issue was resolved.
In addition, the file AttractionIcon.tsx was made to return a user-friendly icon next to each attraction’s name. This was implemented to make the type of attractions clearer from the guidebook screen to give additional context to users where images could be unclear (such as sections of Hadrian’s wall which lie in ruins).
One complication that arose from the decision to have fixed-height stops was that many bus stops on the AD122 route do not have any notable attractions at them. As seen in the figures previously shown, this left a large blank gap in the UI. Figure 54 shows the early solution to this problem was to have a descriptive block of text about the stop. However, the design of this could be considered mundane and did not provide much value to the end user in terms of information. To improve this implementation, a similar solution to the attraction icons was employed by creating a FacilityIcon component. This was used to show what was available at stops that did not have any attractions, informing the user of reasons they may wish to depart here. Some examples of this include food and drink from local pubs, hotels and camping along the route, or toilets. Additionally, this provided a good opportunity to naturally link to websites which contained more detail about facilities in the vicinity of the bus stop should the user wish to read more.
This concluded the development activity completed for sprint 3, having now a comprehensive UI for the guidebook screen and sourced data on stops. Figures 56 & 57 provide screenshots of the UI at this stage.
Figures 56 & 57: Screenshots of the guidebook screen UI at the end of sprint 3.
3.7.4 Sprint 4 – Guidebook Functionality
Sprint 4 aimed to expand on the work in sprint 3 to make the guidebook screen functional with the user’s geolocation. Therefore, a user on the bus would see the guidebook update over time to show their position relative to nearby stops and attractions as set out in FR5. This work will focus on firstly getting the user’s geolocation and secondly writing algorithms to correctly position the user on the route.
The Expo toolchain used to set up the project has a comprehensive library for geolocation features named expo-location. Extensive documentation for which is provided by Expo (2023b) and was used in setting up geolocation features for this application. The resulting code for this task is visible in Guidebook.tsx at lines 71 – 118. Firstly, the user must be prompted to enable the application to access their device location in line with FR6 and privacy regulations such as those set out by the Information Commissioner’s Office (n.d.). For our application to be mindful of user privacy, it only asks users for “ForegroundPermissions”, meaning the application will never access the device location in the background (i.e., when the application is closed). Figures 58 & 59 show screen captures of testing to confirm the app correctly prompted users for permission to use their geolocation on both iOS and Android emulators.
Figures 58 & 59: Screen captures of location permission prompt.
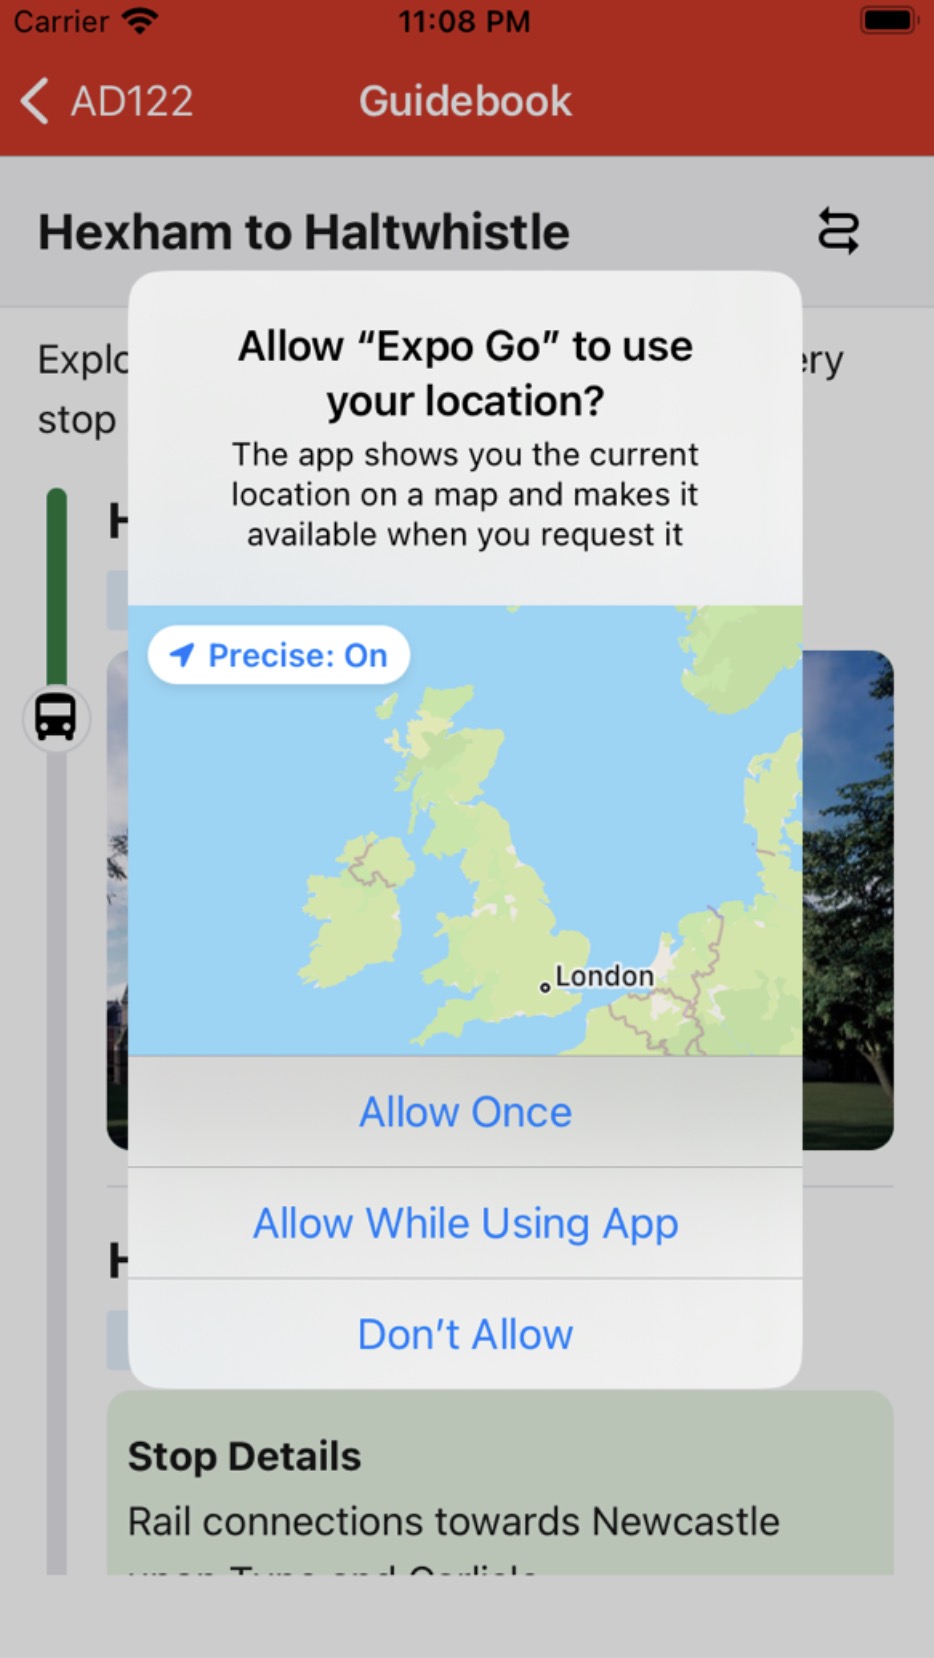
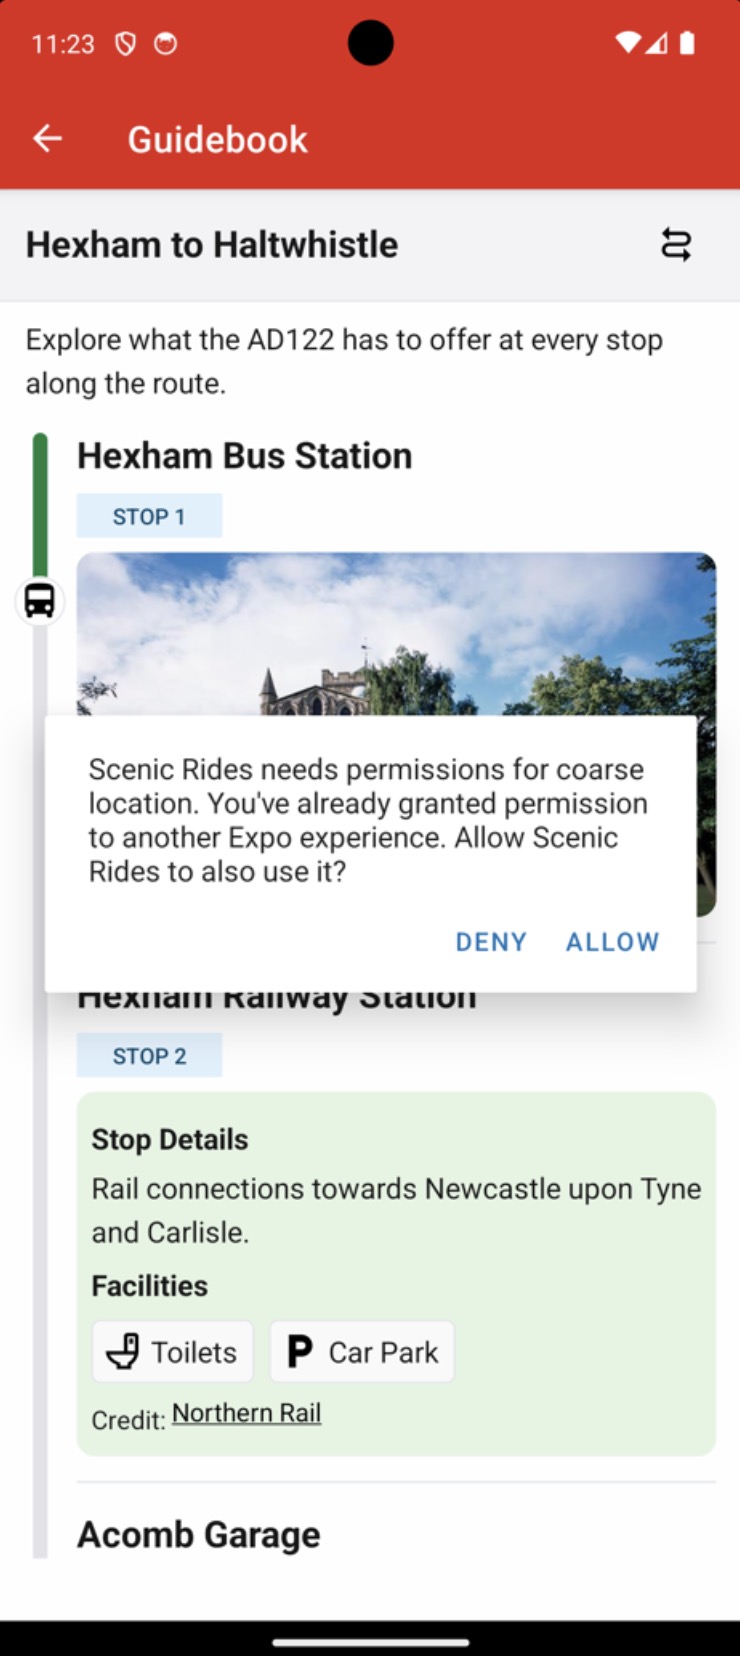
As geolocation features are only required on the guidebook screen, it would be unnecessary to collect location data across the entire application. By utilising the React useEffect hook it is possible to set up code blocks which only fire when a navigational change occurs. Documentation from React Navigation (2023c) discusses “Navigational events” that can be listened to such as a screen coming into “focus” or “blur” meaning the screen was navigated away from. On focus of the guidebook screen, the application is coded to set up a location subscription which is an asynchronous function (Location.watchPositionAsync) that subscribes to location updates from the user’s device. This is configured with a set of options, including high location accuracy (within 10 meters per NFR3) and a distance interval of 10 (updates are received when the user’s location has changed by at least 10 meters). When the subscription receives an updated location from the device, it calls a function which updates the React state of Guidebook.tsx with the new geolocation object containing the user’s longitude and latitude. Utilising React state in this scenario is beneficial as the useState setter function triggers a re-render of any components accessing the state enabling the UI to be automatically refreshed. Correspondingly, a second useEffect adds an event listener to a navigation “blur” event to destroy the location subscription when the guidebook screen unmounts.
Once the application has obtained the user geolocation, it must determine how far along the route they have progressed. This involves the steps discussed earlier in sprint 2 whereby the application should calculate the nearest point (from the route point data collected) to the user’s location and then determine the last and next stops. To ensure the Guidebook.tsx file did not become overpopulated with functions, a separate file in the /src/util directory was created named calculateRouteProgress.ts to handle this logic. A further helper function was required for this task which is located in haversine.ts. This file is named after the haversine formula which is used to calculate the distance between two points on a sphere, hence its application in determining the shortest distance between points on the earth’s surface. Movable Type (n.d.) provides an explanation of this formula as well as a JavaScript implementation which was adapted for this application by converting it to TypeScript. At this point basic testing was carried out to ensure the formula was returning the correct values, however, section 3.8 will discuss how unit testing was later set up for this task.
Using haversine, the nearest point to the user can be calculated by looping through all coordinate data points along the route and keeping track of the one with the lowest distance away in meters. In our bus stops data file (busStops.ts) each stop was preassigned the sequence number of the nearest point to it. Therefore, using comparison logic and factoring in the direction of travel it is possible to determine which was the last and next bus stop along the route. For example, using real data from the AD122, if the user’s nearestPoint is sequence number 52 and Hadrian’s Hotel and Brunton Crossroad’s nearest points are 49 and 56 respectively, the expression 49 < 52 && 52 <= 56 becomes true, hence the last and next stop is determined as illustrated in Figure 60.
Figure 60: Illustration for calculating last and next stops.
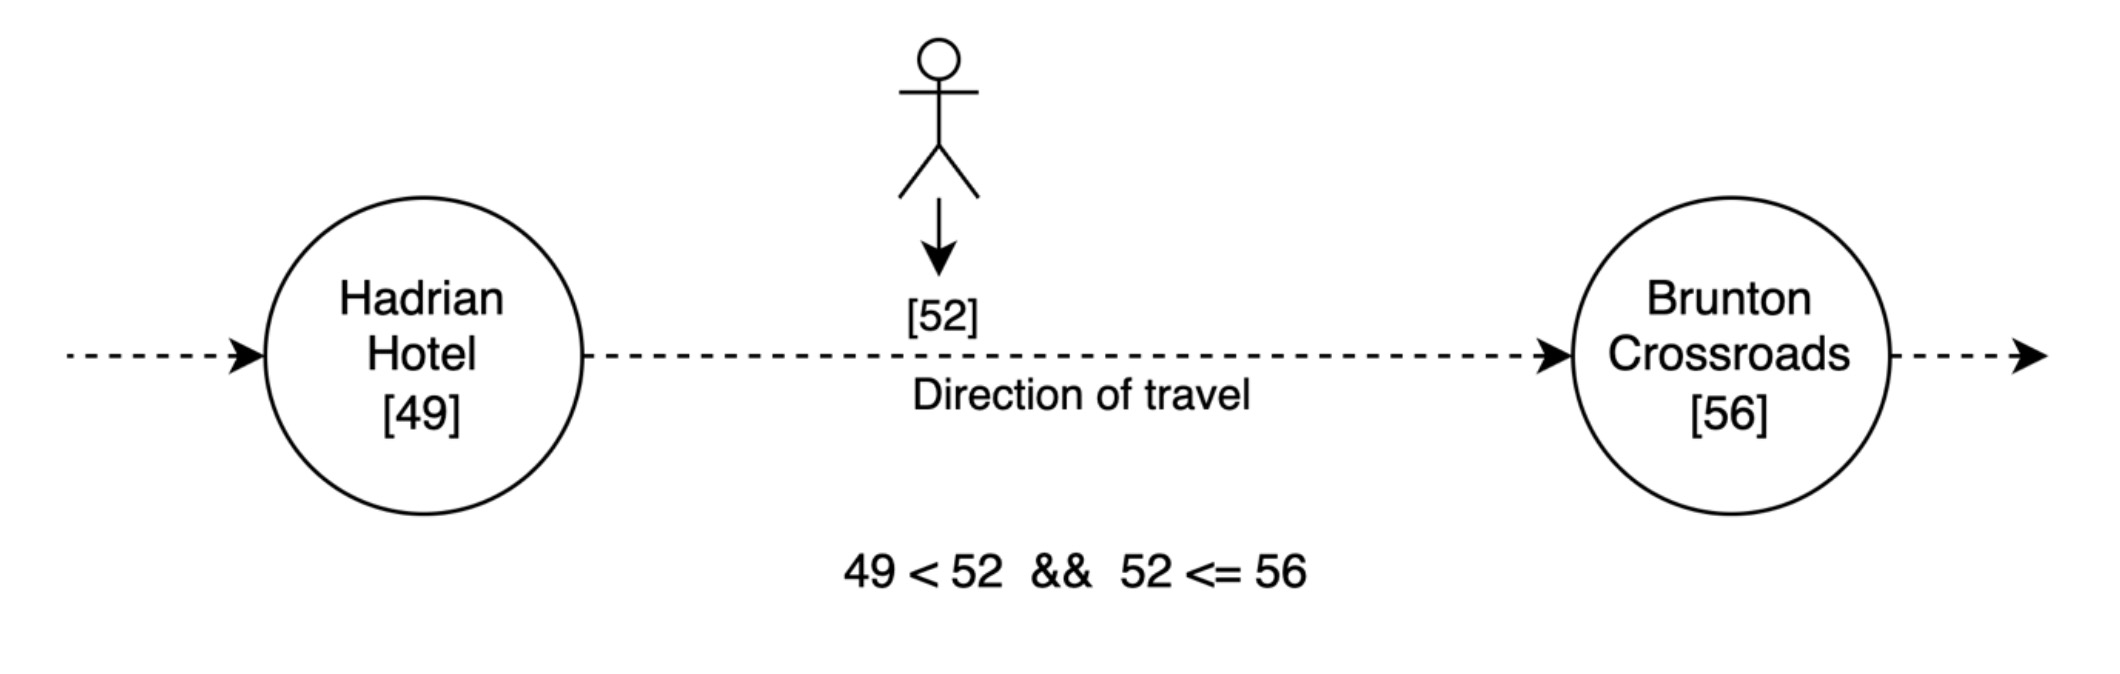
The decision to pre-assign some variables in the data files was made to be considerate of the time complexity of this algorithm. This means the algorithm only needs to loop through all route data points (a total of 442 for the AD122) once to determine the nearest point. Afterwards, preassigned variables such as the nearest point to each bus stop act similarly to that of a cached value to reduce the need for subsequent loops, meaning progress can be calculated more efficiently. This performance enhancement is important as this algorithm runs every time a new geolocation is received, which could slow down the guidebook screen if not correctly implemented. This overall aids in meeting NFR6 which requires the guidebook screen to geolocation and update the UI in a maximum of 2 seconds as this technique achieves a much quicker timing.
Following on, these variables just calculated (nearestPoint, lastStop, nextStop) are passed to another helper function in calculateRoutePercentage.ts which is responsible for calculating how far the user has progressed along the route as a percentage value. This value will later be used to update the progress bar component; hence this percentage is not meant to be a 100% accurate value of the user’s progress but rather a value which works with the UI. I.e., this percentage is looking to achieve a desired visual effect rather than provide accurate reporting. As previously discussed in section 3.7.3 a decision was made that each stop in the UI would have a fixed standardised height. This means we can now make the assumption that each stop passed on the route represents the same per cent of the route travelled. For example, on the AD122 there are 18 total stops, therefore if the user is at stop 9 it is possible to say 50% of the route is travelled regardless of the distance in miles or number of route points passed. In the function calculateRoutePercentage, this variable is named basePercent.
Secondly, the function should calculate how far between the last stop and the next stop the bus has travelled which is named the intermediatePercent. It does so by using the sequence numbers assigned to points and stops along the route. Using the example previously seen, this calculation is visually illustrated in Figure 61. In this example, a user at point 52 has travelled circa 42% between the last and next stops.
Figure 61: Illustration of intermediate percentage calculation.
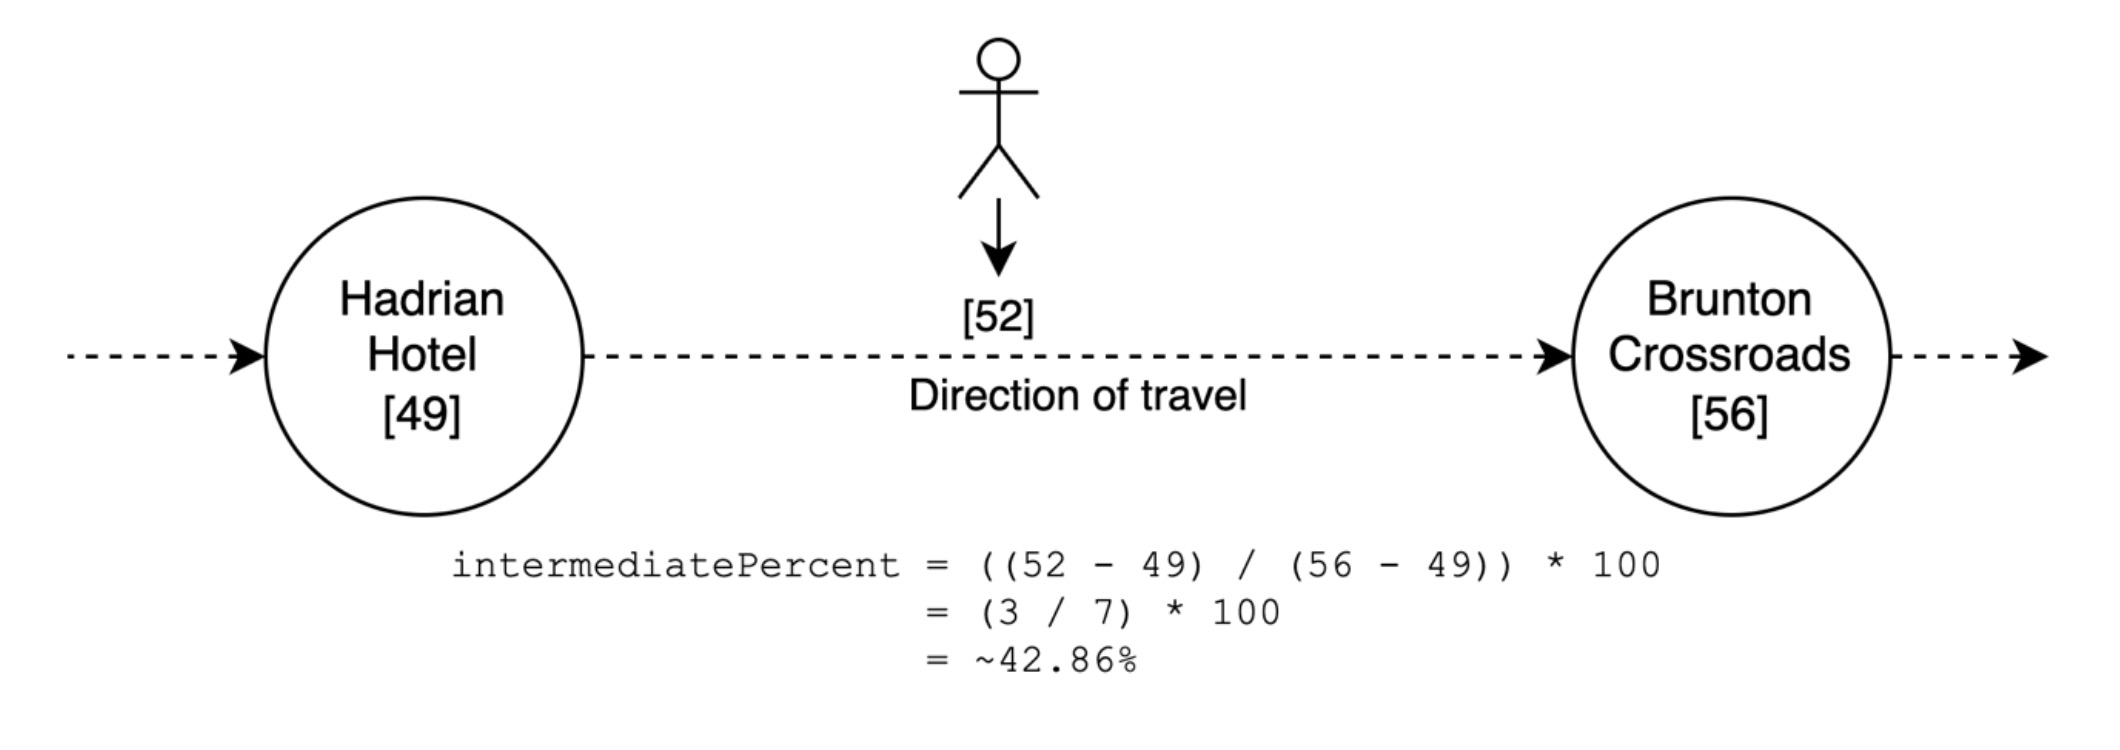
As this percentage represents a value for the distance between only two stops, it is then divided by the total number of stops on the route which adjusts it to be aligned with the base percent. Afterwards, the basePercent and intermediatePercent can be simply added to get the total percentage of the route travelled.
This total percentage is now returned to the guidebook screen and updated in React state which retriggers a render of the ProgressBar component. Recapping on section 3.7.3 this component was designed with two elements, a green progress bar and a bus icon, both with dynamic heights based on the prop percentage passed in. Therefore, the progress bar now resizes its height to accurately reflect where the user is along the route by aligning with the list of stops. Secondly, using a ScrollView Ref (React Native, 2023c) the user’s screen will automatically scroll down to position itself to focus on the next upcoming stop on the route. This feature means the user does not need to scroll the whole list of stops themselves to find where they are currently positioned.
The final work of sprint 4 was to make the guidebook screen functional should the user deny geolocation permissions per FR6 and FR7. Currently, if a user denies permission to use their location the progress bar will be visible but not work (i.e., it will freeze at the first stop). This could be a confusing implementation for users to leave a non-functional element of the UI visible. Therefore, the decision was made to simply hide it, turning the guidebook into a static list of stops and attractions. This was achieved by checking if the response from the geolocation permissions request was granted, if not using React conditionals the ProgressBar component is not rendered. The guidebook screen shown to a user who denies geolocation features is shown in Figure 62.
Figure 62: Screen capture of guidebook screen with geolocation permission denied.
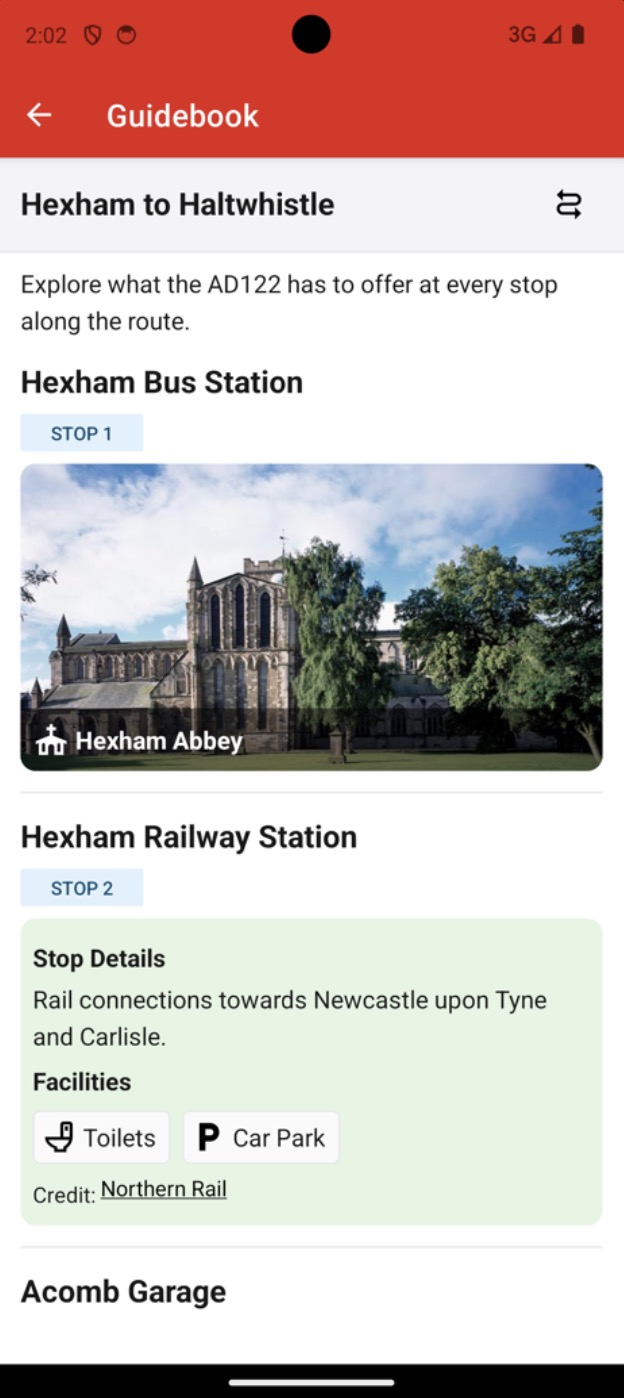
This concluded the work of sprint 4 to make the guidebook screen operational. To ensure these features worked as expected, manual testing which involved manipulating the device’s geolocation through an emulator was carried out to ensure functions returned the correct values and the progress bar was updated appropriately. This initial testing was to establish a proof of concept in the progress bar and the ideas discussed here in its implementation. Furthermore, unit and automated testing methods were set up, as will be discussed in a later section.
3.7.5 Sprint 5 – Attractions Data Collection and Screen
Sprint 5 covers the development of the attraction screen for points of interest along the route. This screen aims to provide the user with more information on each attraction, such as a brief descriptive section, opening times, contact details, and links to the attraction’s website.
Firstly, research was conducted on each attraction to identify an authoritative online source where information could be obtained. Ideally, the organisation which officially represents the attraction would be used, otherwise reputable sites such as English-heritage.org.uk (English Heritage, n.d.) were a suitable alternative. The information collected was inputted into the attractions.ts data file for the AD122 route. Through utilising several TypeScript type aliases, custom types were created such as ContactDetails and OpeningTimes to represent more complex data that was required. Additionally, reusable types were created for accrediting sources such as Credit, ImageCredit, and a CreditFooter component as it would be important to cite sources used to gather content per FR11 and with respect to copyright regulations.
The use of a separate data file for attractions helped to achieve NFR2 in ensuring the application remains expandable. This meant a single file for the attraction screen (Attraction.tsx) could be used to structure the page and dynamically display each attraction’s content. Each attraction was assigned a unique numerical id which was passed through the React Navigation router link from the guidebook screen. Consequently, the attraction screen can filter through attractions to get the correct data from this id parameter and render it to the user. A simplistic approach was taken to the designing of this screen, in that it aimed to focus on text and image-based content over implementing elaborate features. Likewise, care was taken not to overwhelm the user with content so they can enjoy the scenic route instead of feeling the need to read their phone screen. The first iterations of this screen are visible in Figures 63 & 64.
Figures 63 & 64: Attraction screen first iterations.
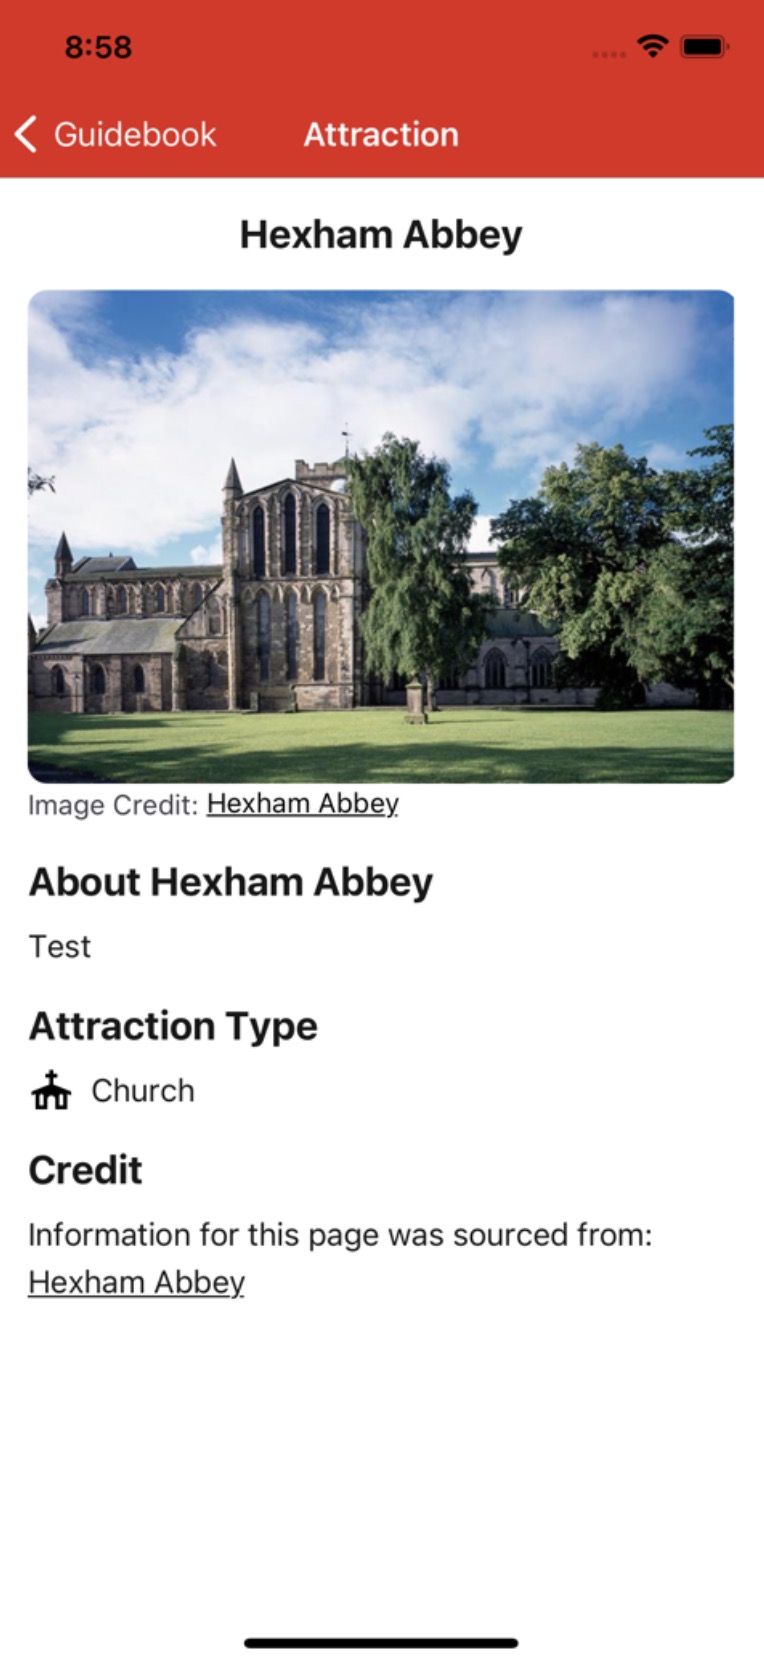
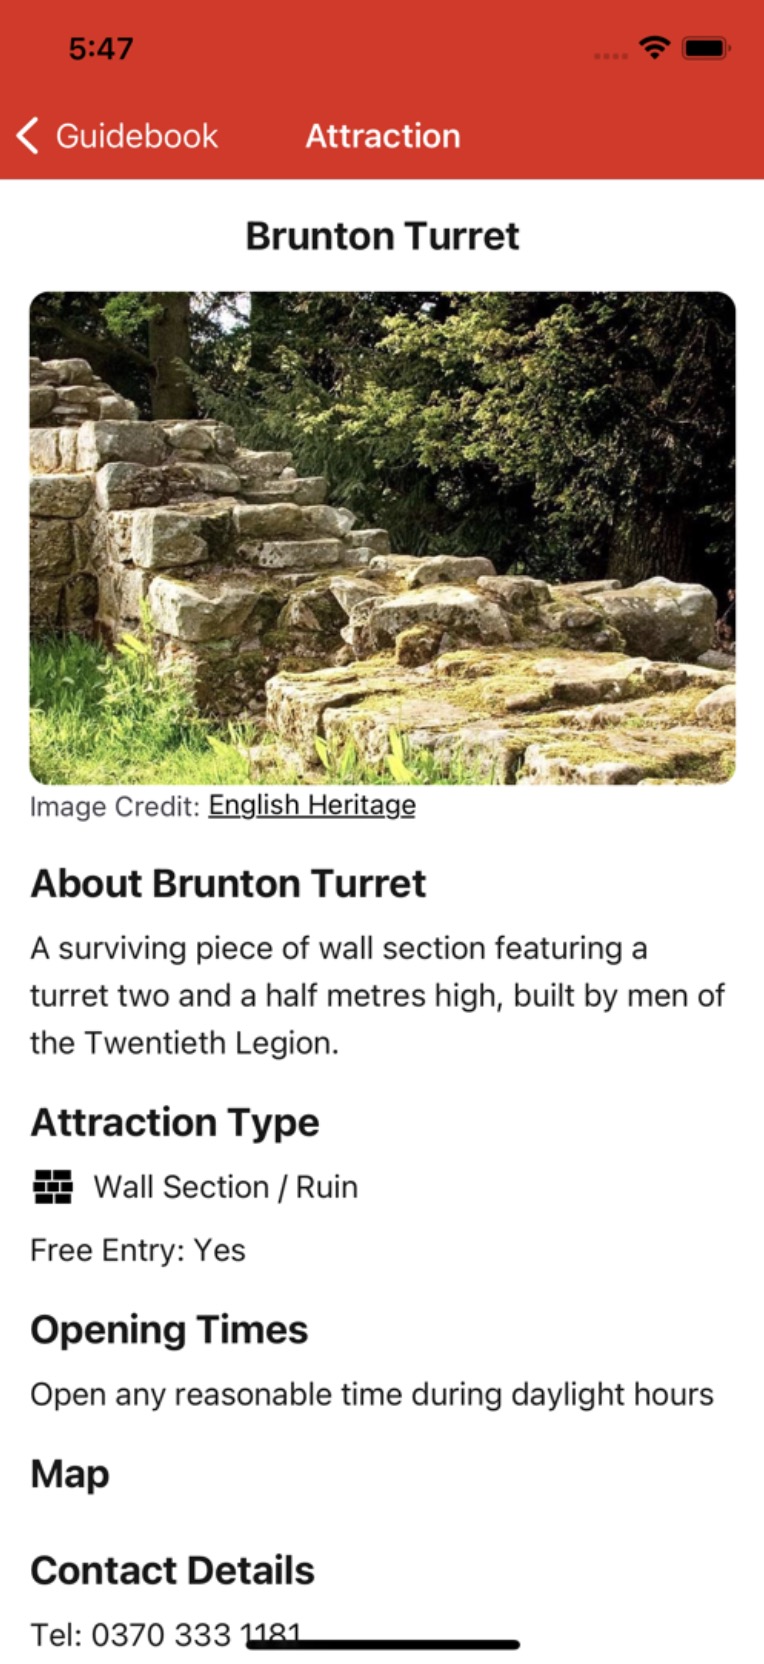
As previously discussed in section 3.7.2, one of the motivations for plotting data in the Google My Maps platform was to export sections of the map as static images which could be embedded on a per-attraction basis. This creates a visual aid for users to establish spatial awareness of each stop and attraction. Exploring the Google My Maps platform, it was possible to add an additional layer to the map showing directions between two points. This would be useful to illustrate walking directions from the nearest bus stop to the attraction being viewed. However, following a period of trial and error, this feature was abandoned due to the low accuracy of directions being outputted. This is illustrated for just one attraction, Chesters Bridge Abutment, in Figure 65 whereby the directions provided by Google Maps went off course. This problem was common across many attractions, possibly due to the rural setting meaning walking routes are not adequately mapped. Therefore, the decision was made to embed maps without directions given this factor. These were simply static images exported from Google My Maps centred around the bus stop and the attraction’s location.
Figure 65: Error with Google My Maps walking directions.
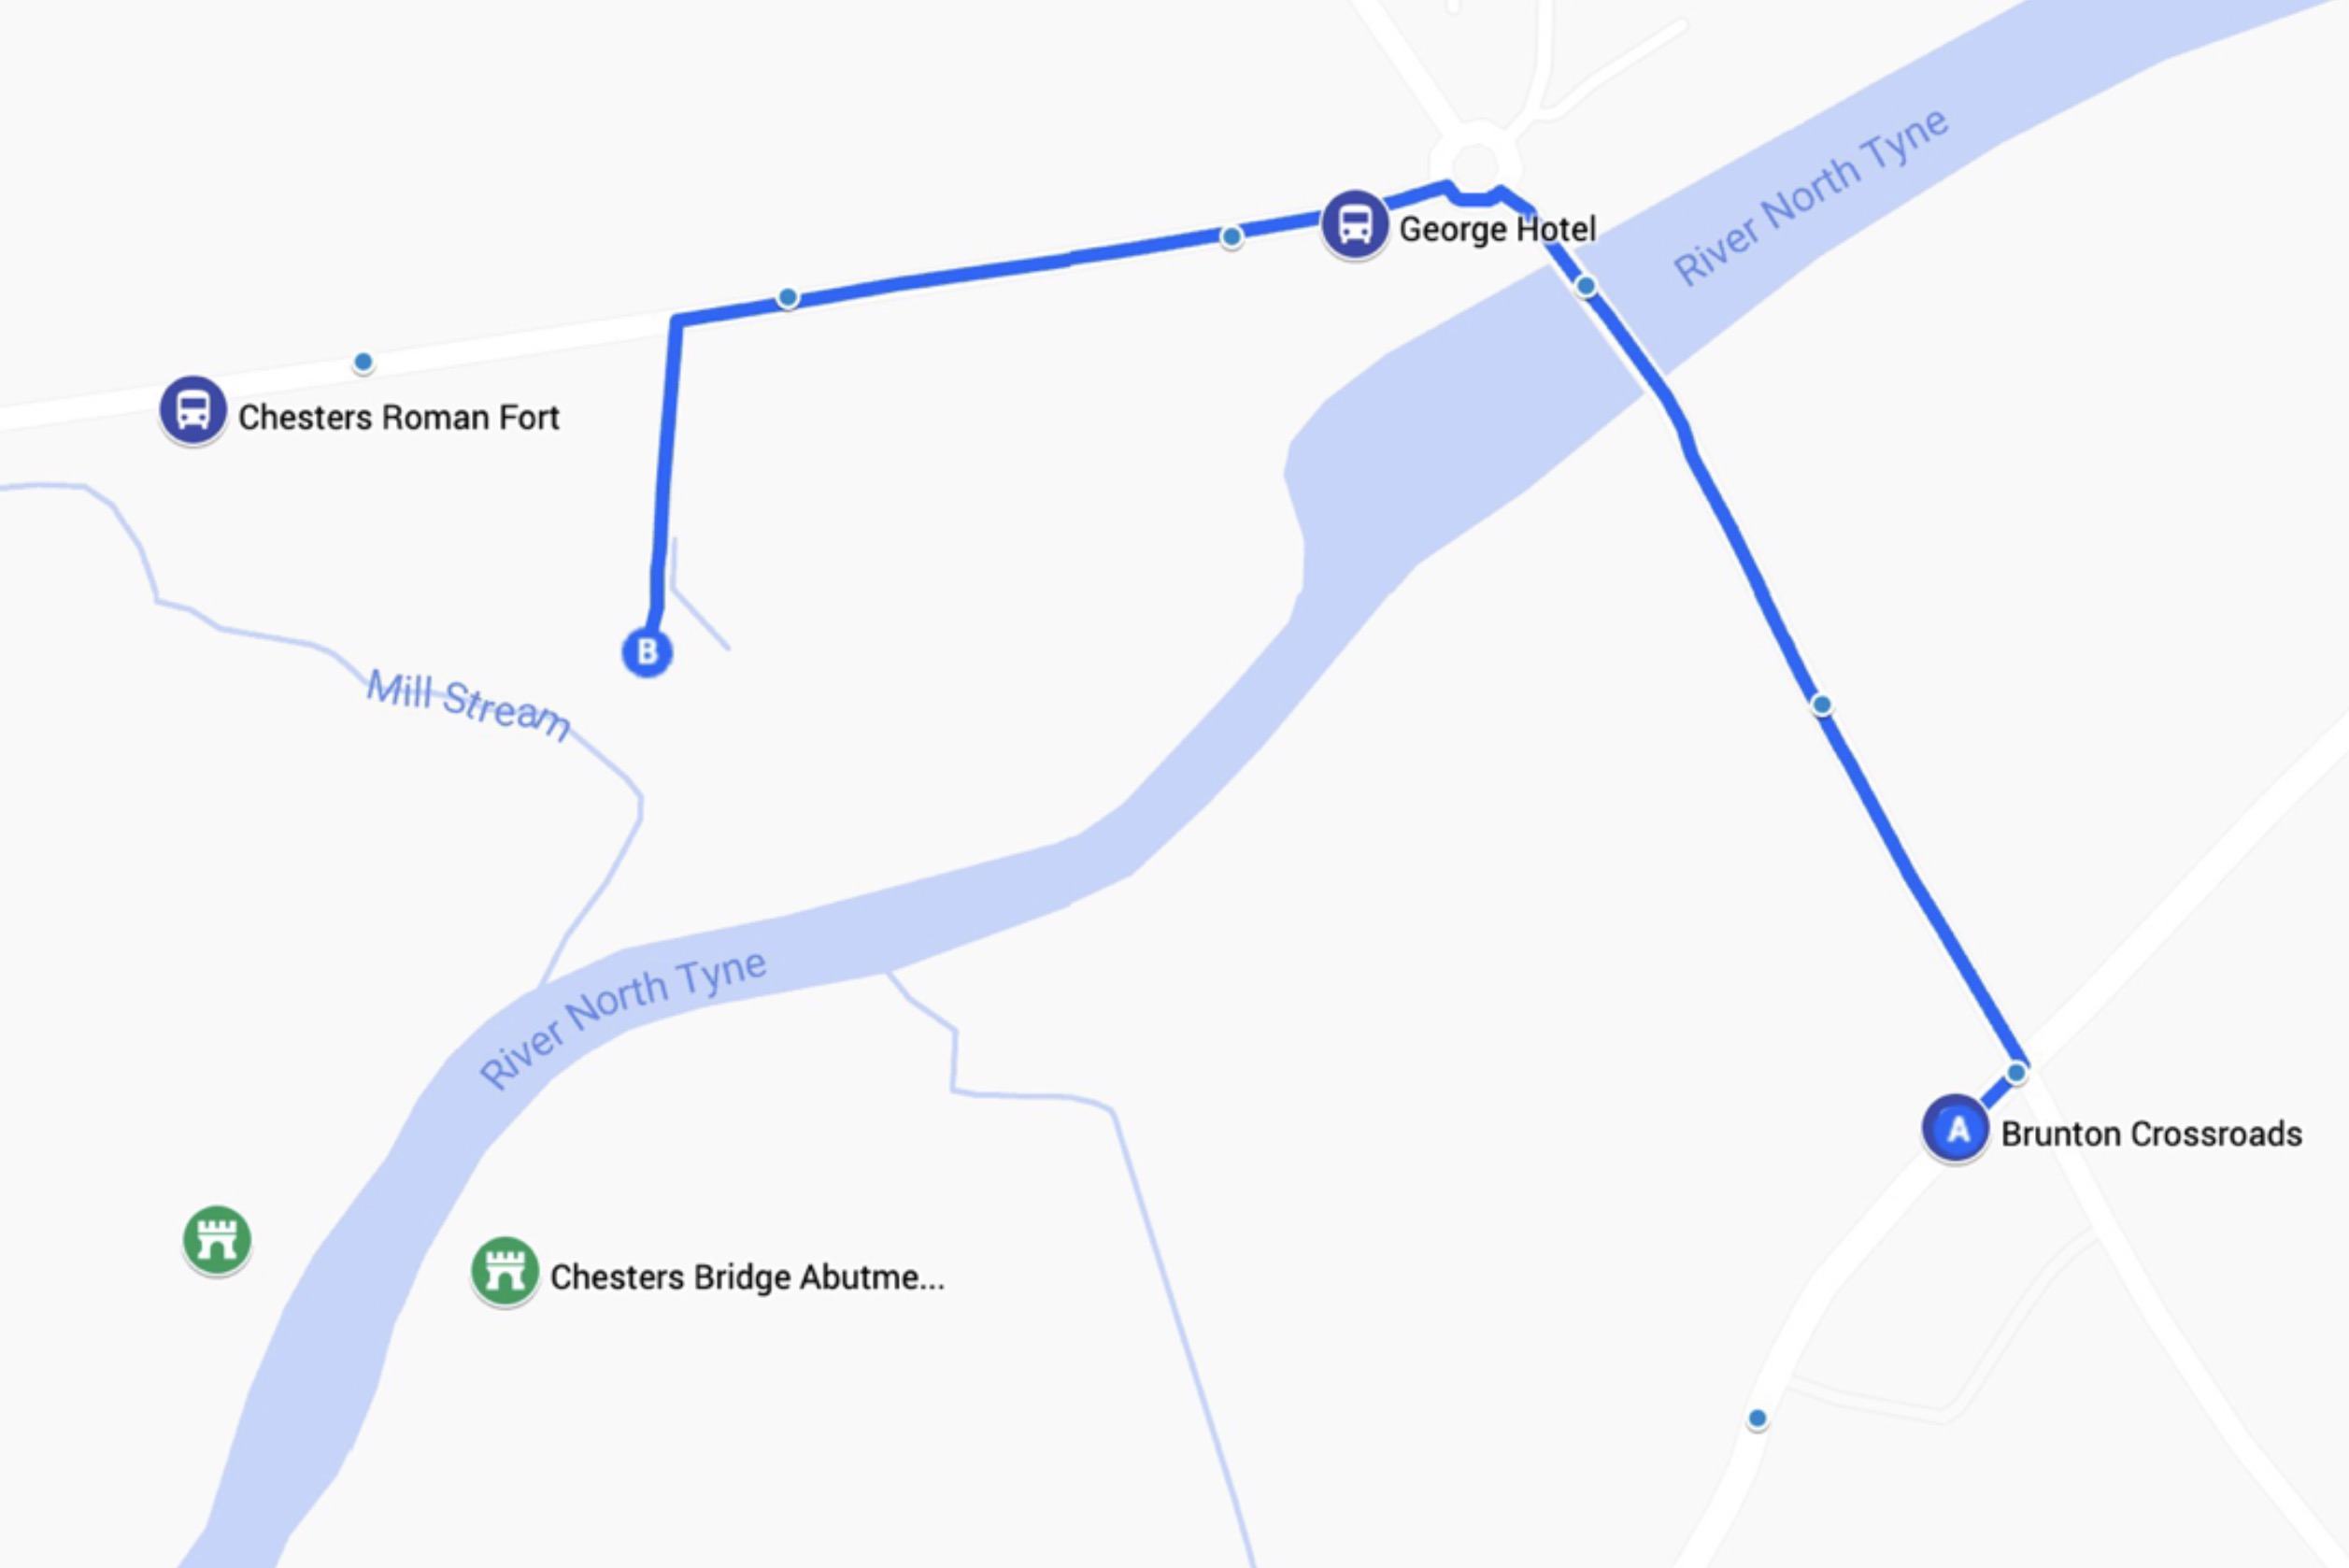
This work concluded sprint 5, with results for three attractions provided in Figures 66 – 68.
Figures 66, 67 & 68: Screenshots showing the result of the attractions screen.
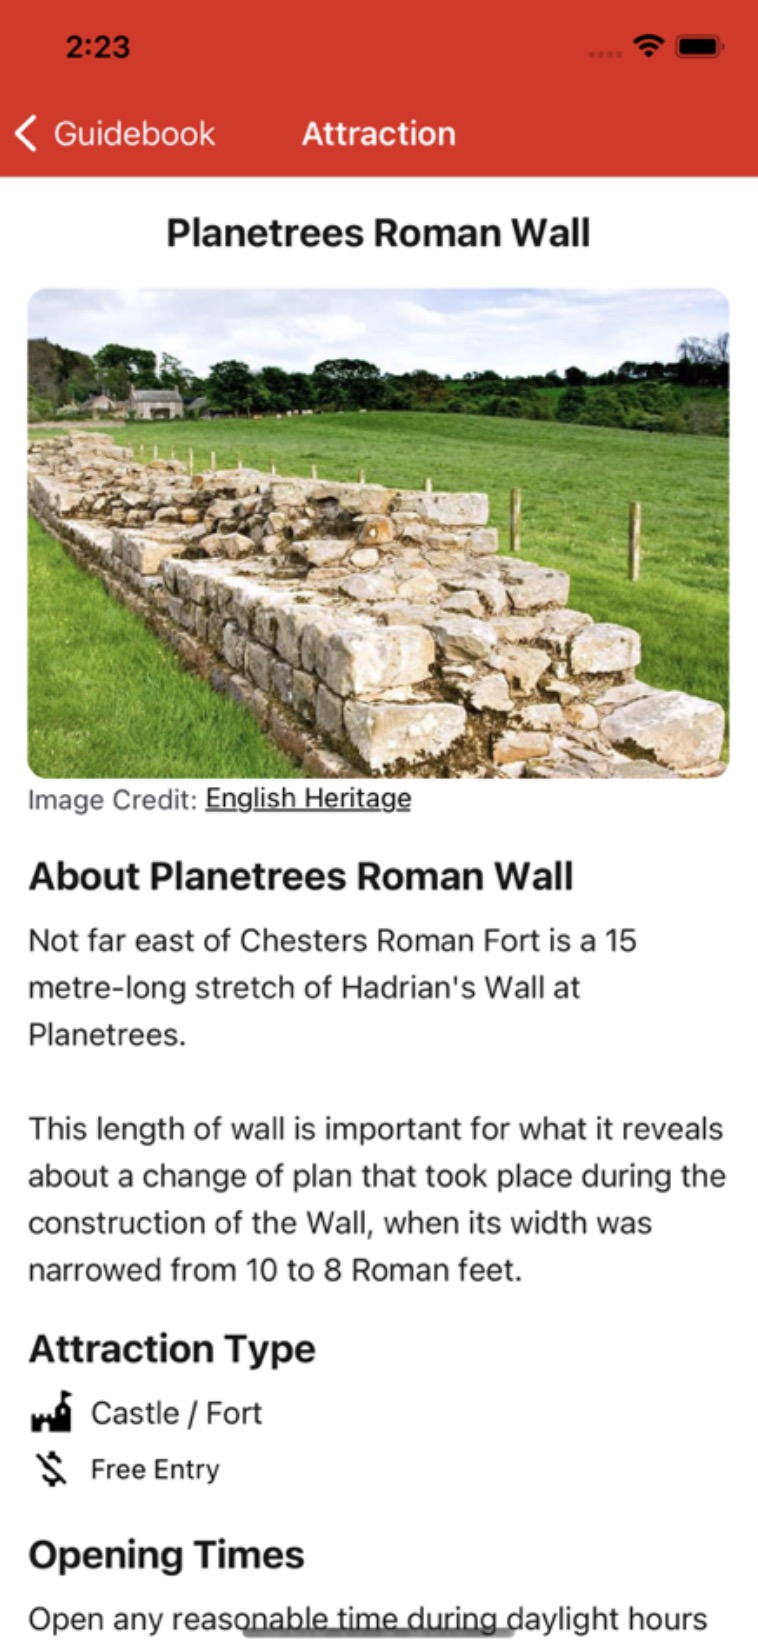
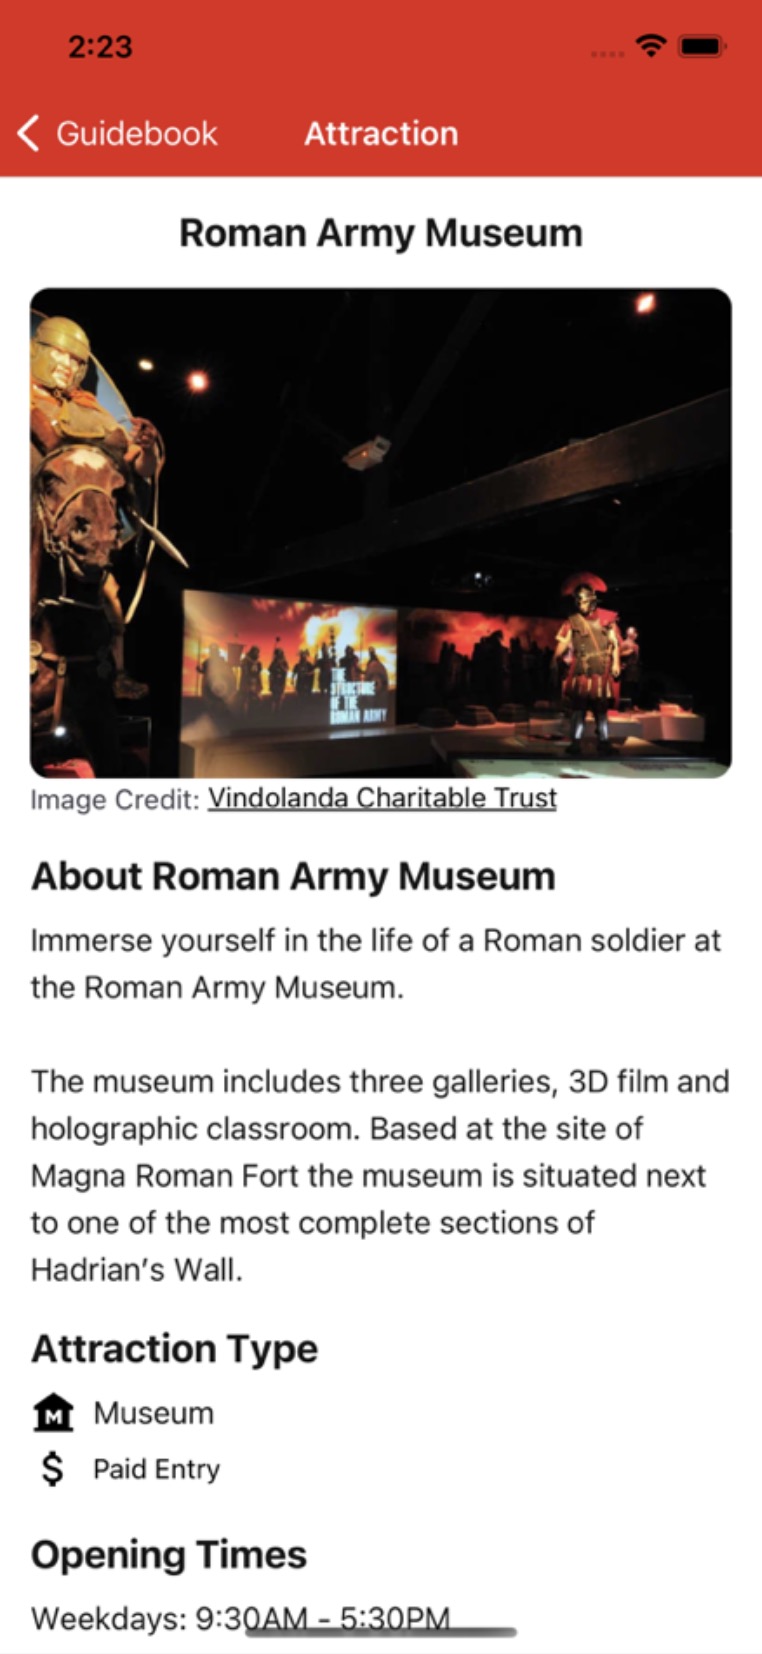
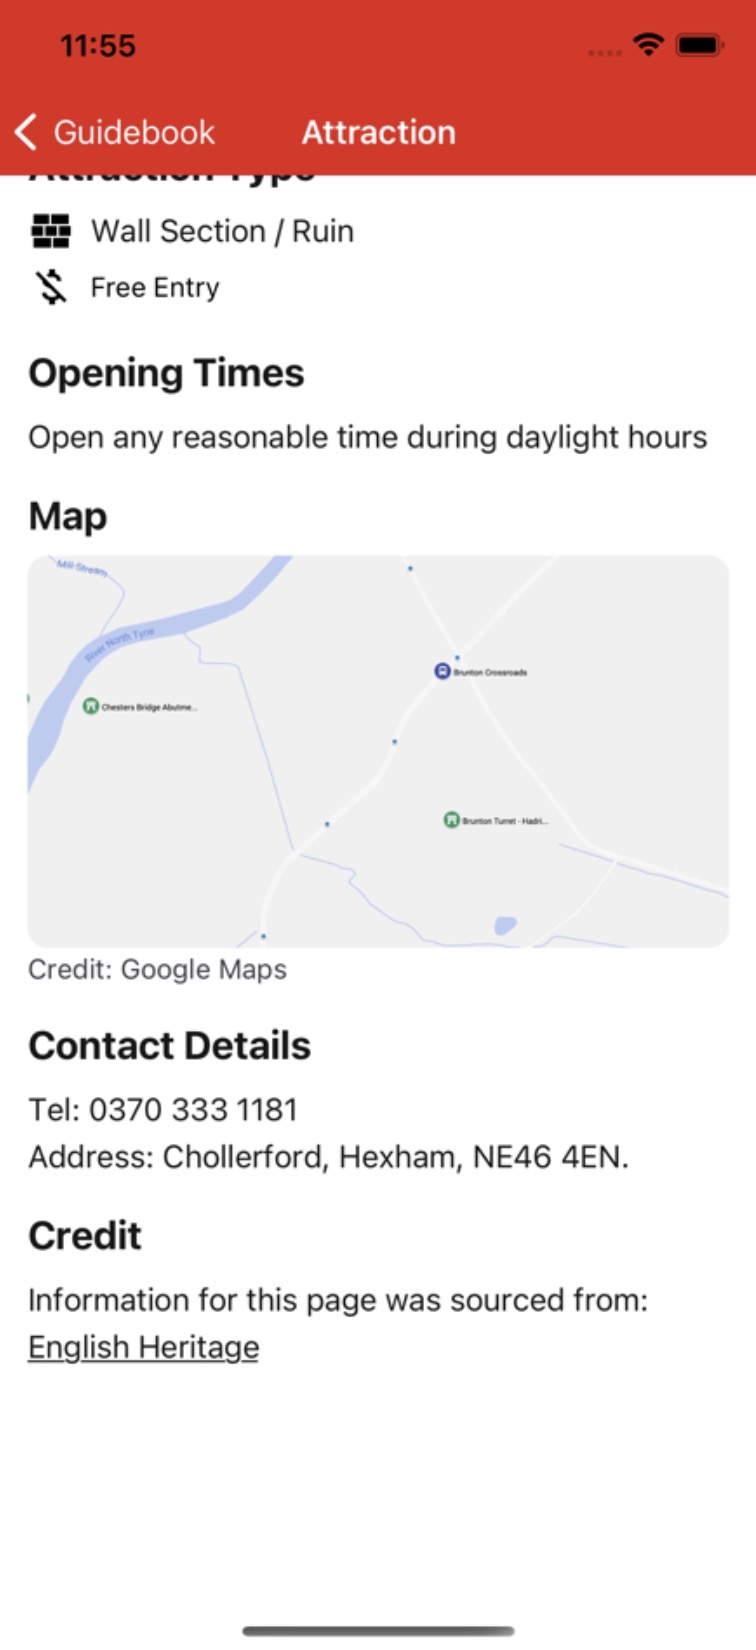
3.7.6 Sprint 6 – About and Help Screens
Sprint 6 activity would focus on creating the about and help screens for the application. This firstly involved setting up a link to access each screen from the homepage as planned in the mock-ups. This was simply a button for each which sat in the bottom corner of the screen and is depicted in Figure 69.
Figure 69: About and Help Screen Navigational Link Buttons.
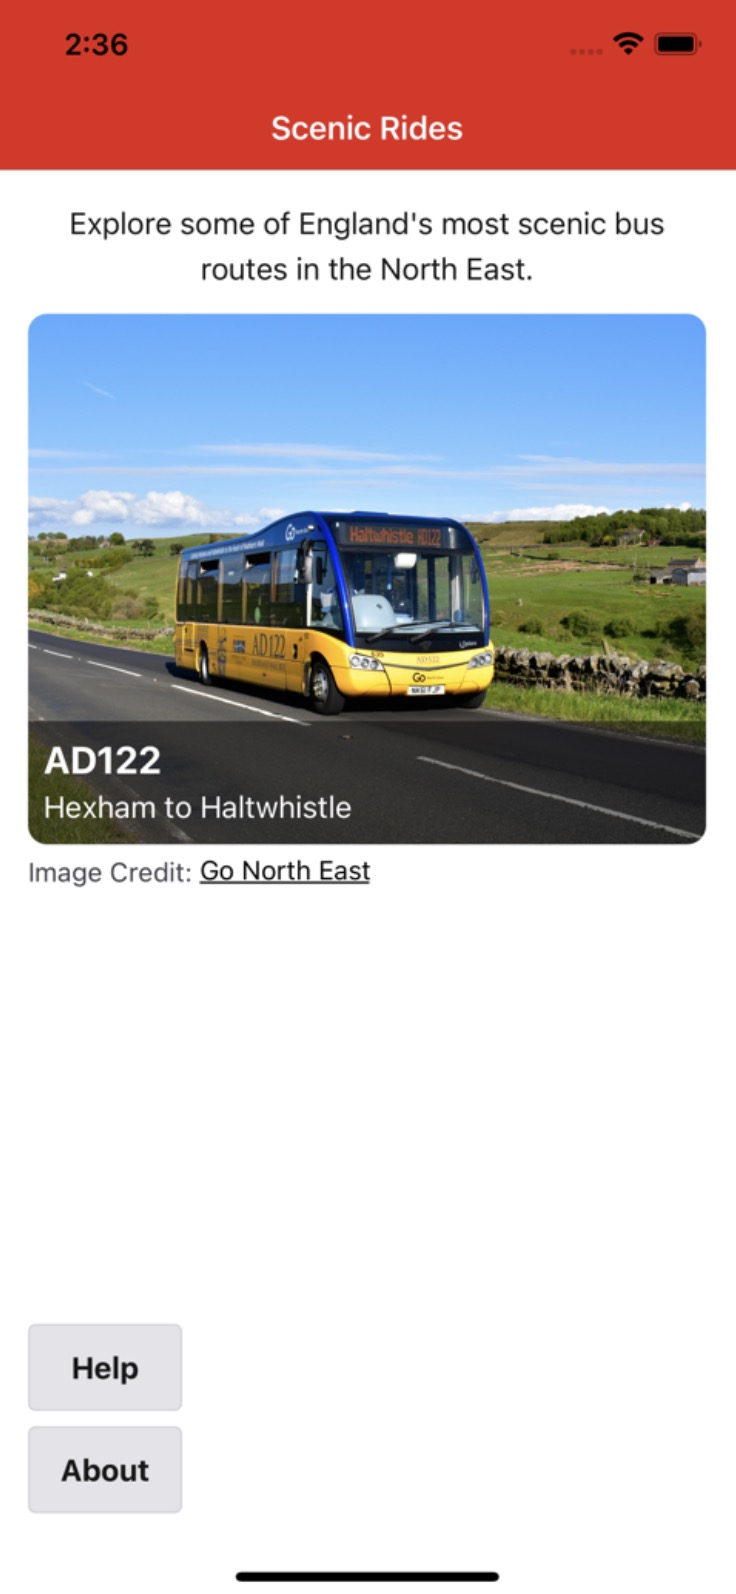
The about screen aims to provide a basic summary of the application to users and a comprehensive list of all software and sources used to create the app. On the other hand, the help screen would act as an in-app user manual for those needing guidance or clarification of how a feature works. It lists common tasks that can be achieved in the application in a frequently asked questions format. To create the help screen, a FaqDropdown component was created so the user can see all questions and click to show or hide the answer to each. This work concluded the overall short sprint 6 and is pictured in Figures 70 & 71 showing the about and help screens respectively.
Figures 70 & 71: Screen captures of the about and help screens.

3.7.7 Sprint 7 – Refactoring, Bug Fixes, Commenting, and Documentation
Sprint 7 was the final sprint in the development of this application and acted as a retrospective to evaluate what had been developed, fix bugs, and refactor code where improvements could be made.
3.7.7.1 Refactor of the Coordinate Type
The Coordinate type alias was refactored to a Coordinate class in the types.ts file. This was made in reflection that TypeScript type aliases provided a good method to represent JavaScript Object data structures, however, they provided no benefit in ensuring objects are initialised with the correct parameters. By using a class to represent a coordinate, basic data validation like ensuring latitude points are between -90 and +90 could be carried out in the class constructor. This refactor helped provide assurances that no stray coordinate values were entered in a data store file. Despite these values not being provided by the user, a developer error could still lead to a mistake in data points used throughout the application.
3.7.7.2 Route Progress Function Bug Fixes
Secondly, a bug was identified where the functions calculateRouteProgress and calculateRoutePercentage had failed to account for the direction of travel correctly. The impact of this bug could be seen in the UI whereby the progress bar incorrectly updated for inbound travel. By retracing the logic, it was identified this bug was caused by not accounting for the array of bus stops being sorted in the opposite order if the direction was inbound. Consequently, the order of the lastStop and nextStop variables had become muddled. This was possible to fix by checking the direction in an if statement and adjusting the logic appropriately.
3.7.7.3 Error Messages
Per NFR7, if an error occurs the user should be given a concise message and offered a chance to recover (e.g., navigate away). During the development, TypeScript provided helpful hints which indicated an error may occur should the data store files fail to populate into React state for a screen, hence causing the data to be undefined. Therefore, error messages such as “Sorry, an error occurred loading the attraction data. Please return home or restart the application” were provided to cover these instances, along with a button titled “Return Home” to navigate away from the error.
3.7.7.4 Image Compression
As discussed in section 2.4.3, static assets would be bundled with the application binary to reduce reliance on network usage. This unfortunately can make the overall installation size of the application larger, which is generally bad practice as the developer should be considerate of how much storage space their application consumes on the user’s device. One culprit for increasing application size is unoptimized images, which was a total of 15MB of JPEG images in the case of this application. WebP (Google, 2023a) is a newer format for images which can save space over JPEGs. Utilising the cwebp command line tool (Google, 2023b) existing images could be converted to WebP format and resized appropriately for a mobile device. An example command for this task to reformat an image is cwebp -q 100 ./src/assets/img/vindolanda.jpg -o ./src/assets/img/vindolanda.webp. Overall, this led to a reduction of over 10MB in space taken for images in the application.
3.7.7.5 JSDoc Comments
Comments were added for functions in JSDoc (n.d.) format to provide in-code documentation to those reading the codebase. These aimed to describe what the function was responsible for doing, provide citations to documentation used, and explain the rationale behind certain implementations. One exception was made to the standard JSDoc format in that type hints for parameters were excluded from comments. This is a common implementation for TypeScript codebases as TypeScript itself provides strict data typing for function parameters and return values. Hence, adding types to JSDoc simply repeats the work achieved by TypeScript. Furthermore, inline comments were added to sections of code which contained sophisticated logic that required additional explanation.
3.7.7.6 Readme and Developer Documentation
A project README.md file was updated in the root directory to contain basic information a developer would need to get started with the project, such as project commands, a visual representation of the structure, and links to credit open-source libraries and sources used in the application’s development.
Finally, to supplement in-code comments and the Readme file, Appendix 2 contains a more detailed set of documentation for developers detailing running the project and the schema of the data store components.
3.8 Application Testing Strategies
Several strategies were employed to test the application. The three main strategies used were unit testing, automated testing, and system testing. This section will continue to discuss each of their use cases. Although this section is included after all sprints in the dissertation, tests were often written alongside each sprint. This meant each section of code could be tested before moving on to the next iterations of work.
3.8.1 Unit Testing with Jest
Jest (n.d.) is a JavaScript testing framework that can be used for a variety of use cases. In this project Jest was utilised for two main purposes; to unit test functions and to validate that data store files did not contain errors. Jest was installed to the project as a node module and can be configured in a jest.config.js file, documentation for these tasks is provided by Jest (2023a) and Expo (2023c) for React Native and TypeScript projects. Test files were integrated into the project structure by adding a folder named __tests__ to subfolders of the src directory. It is standard practice to name test files as follows haversine.test.ts for haversine.ts.
Unit testing was specifically helpful for testing standalone functions which take a set of inputs and return a specified value which can be determined to be correct or incorrect. For example, functions implemented in this project such as calculateRouteProgress and haversine were ideal candidates for unit tests. Jest’s syntax is mostly self-explanatory, in that you declare a function called test whose first parameter is a descriptive name of the test. Using what Jest (2023b) calls “Matchers”, syntax such as expect(x).toBe(y) defines the test case. Similarly, tests were written in the same style to test data entered in the data store was correct. As these files must be manually created by the developer, they could be prone to input errors. Tests to check for correctness included checking fields that act like a foreign key exists in alternate data files and checking sequence numbers for points were ordered correctly. Overall, these tests ensured a variety of inputs including edge cases were tested against and passed.
3.8.2 Automated Testing
Automated testing for this project refers to automating the process of testing geolocation features through device emulators and scripting. One impracticality faced during development is that it would be unreasonable to ride the AD122 bus journey in person to see how the application would respond on the actual route. As software development is typically never correct on the first iteration of work, having to test such as feature in-person would be near on impossible in a rural setting. To resolve this issue, device emulators enable the developer to manually manipulate the longitude and latitude location of their device. This technique was used extensively throughout development; however, it remains rather static as only a single point can be updated at a time. Emulators do offer the option to upload a set of coordinate points which can be looped through. But unfortunately, the file format required for Android Studio was not possible to easily extract from data already collected and Xcode disables this feature for React Native applications.
A workaround solution was implemented to solve this problem which is located in ./automated_testing in the codebase. This is a script written in Python which reads a CSV file containing the coordinate points along the AD122 route and feeds them into the Xcode simulator to update the device’s geolocation every couple of seconds. This script was designed to be run on the MacOS operating system and therefore its portability to other developer machines is not a guarantee. Nonetheless, it provided a practical and automated solution to emulate what the user would see on their device should they be on a moving bus. This method streamlined the process of testing the whole route and geolocation features of the guidebook.
3.8.3 System Testing
System testing was used to evaluate the application against its requirements. This type of testing was manual in that it involved the developer testing features as they were developed. It aimed to focus on how the application functioned and visually appeared to users. NFR1 states the application must be compatible with iOS and Android devices, therefore a range of phones of varying models and operating systems were used to run the application on emulators for these tests. Furthermore, a variety of screen dimensions were tested to ensure the application design was responsive to different screen heights and widths. The full range of emulators used is set out in Table 4.
Table 4: Device Emulators used in development and testing.
| Operating System | Device Model | Screen Dimensions |
|---|---|---|
| iOS 16.4 | iPhone 14 | 2532 by 1170 pixels |
| iOS 16.4 | iPhone SE (3rd gen) | 1334 by 750 pixels |
| Android 14 | Pixel 6 | 2400 by 1080 pixels |
| Android 14 | Pixel 3a | 2220 by 1080 pixels |
Specific tasks were defined which would help evaluate if the application functioned as intended. These tasks were based on the activity UML diagrams in section 3.4.3 which detail how the application should respond to users loading a screen. All tasks tested are detailed in Table 5 and were run on all devices listed above to collect complete results. A test could achieve one of three outcomes:
- “Pass” – the application passed the test without errors.
- “Soft pass” – the application failed an element of the test, but it was corrected resulting in a pass once fixed.
- “Fail” – the application failed the test set out.
Table 5: Tasks completed as part of system testing.
- Task: The user opens the application.
- Expected Outcome: The home screen shows a list of routes set up for the application.
- Result: Soft pass. On 1 of 4 devices a bug with the homepage image was found and is detailed in Appendix 3. It was later fixed resulting in a pass.
- Task: The user clicks to view a bus route.
- Expected Outcome: The application will load route data and display the user a screen with these details.
- Result: Pass. On all devices details of the route were loaded and displayed correctly to the user.
- Task: The user clicks to view the route guidebook.
- Expected Outcome: The application should load data on the route (e.g., its stops, points, and attractions) and ask for geolocation permission.
- Result: Pass. All devices successfully loaded the guidebook data and asked for geolocation permission from the user.
- Task: A user grants geolocation permission on the guidebook screen.
- Expected Outcome: The application should use the device’s location to work out the user’s progress along the route and display it in the
ProgressBarcomponent. - Result: Pass. All devices updated to show the user’s progress. Further tests were carried out by simulating different locations with emulators.
- Task: A user denies geolocation permission on the guidebook screen.
- Expected Outcome: The application should show a list of bus stops and attractions, but not the
ProgressBarcomponent. - Result: Pass. All devices where geolocation permission was denied showed a static list of stops and attractions.
- Task: A user clicks to view an attraction screen.
- Expected Outcome: The application should load data on the attraction and display it to the user.
- Result: Pass. All devices successfully loaded the attraction screen.
- Task: A user clicks to view the about screen.
- Expected Outcome: The application displays the about screen.
- Result: Pass.
- Task: A user clicks to view the help screen.
- Expected Outcome: The application displays the help screen.
- Result: Pass. Additionally, testing was completed the check the dropdown FAQ questions functioned as intended.
Finally, as discussed in section 3.3.3, a colour blindness test was conducted to test the contrast of UI elements. The results of which have been included in Appendix 4.
3.9 Development Summary
This chapter now concludes having discussed the overall approaches taken to planning, designing, implementing, and testing this software project. Subsequent sections will focus on evaluating the work completed.
Chapter 4: Results and Evaluation
Chapter 4 will firstly focus on the results obtained in the finalised application and secondly complete an extensive evaluation including user feedback to discuss the merits and limitations of the project.
4.1 Final Application
Figures 72 – 75 show each of the finalised application main screens. These can be compared to mock-ups in section 3.3 to show how the application overall remained original to its initial designs.
Figures 72, 73, 74 & 75: Screen captures of the finalised application.
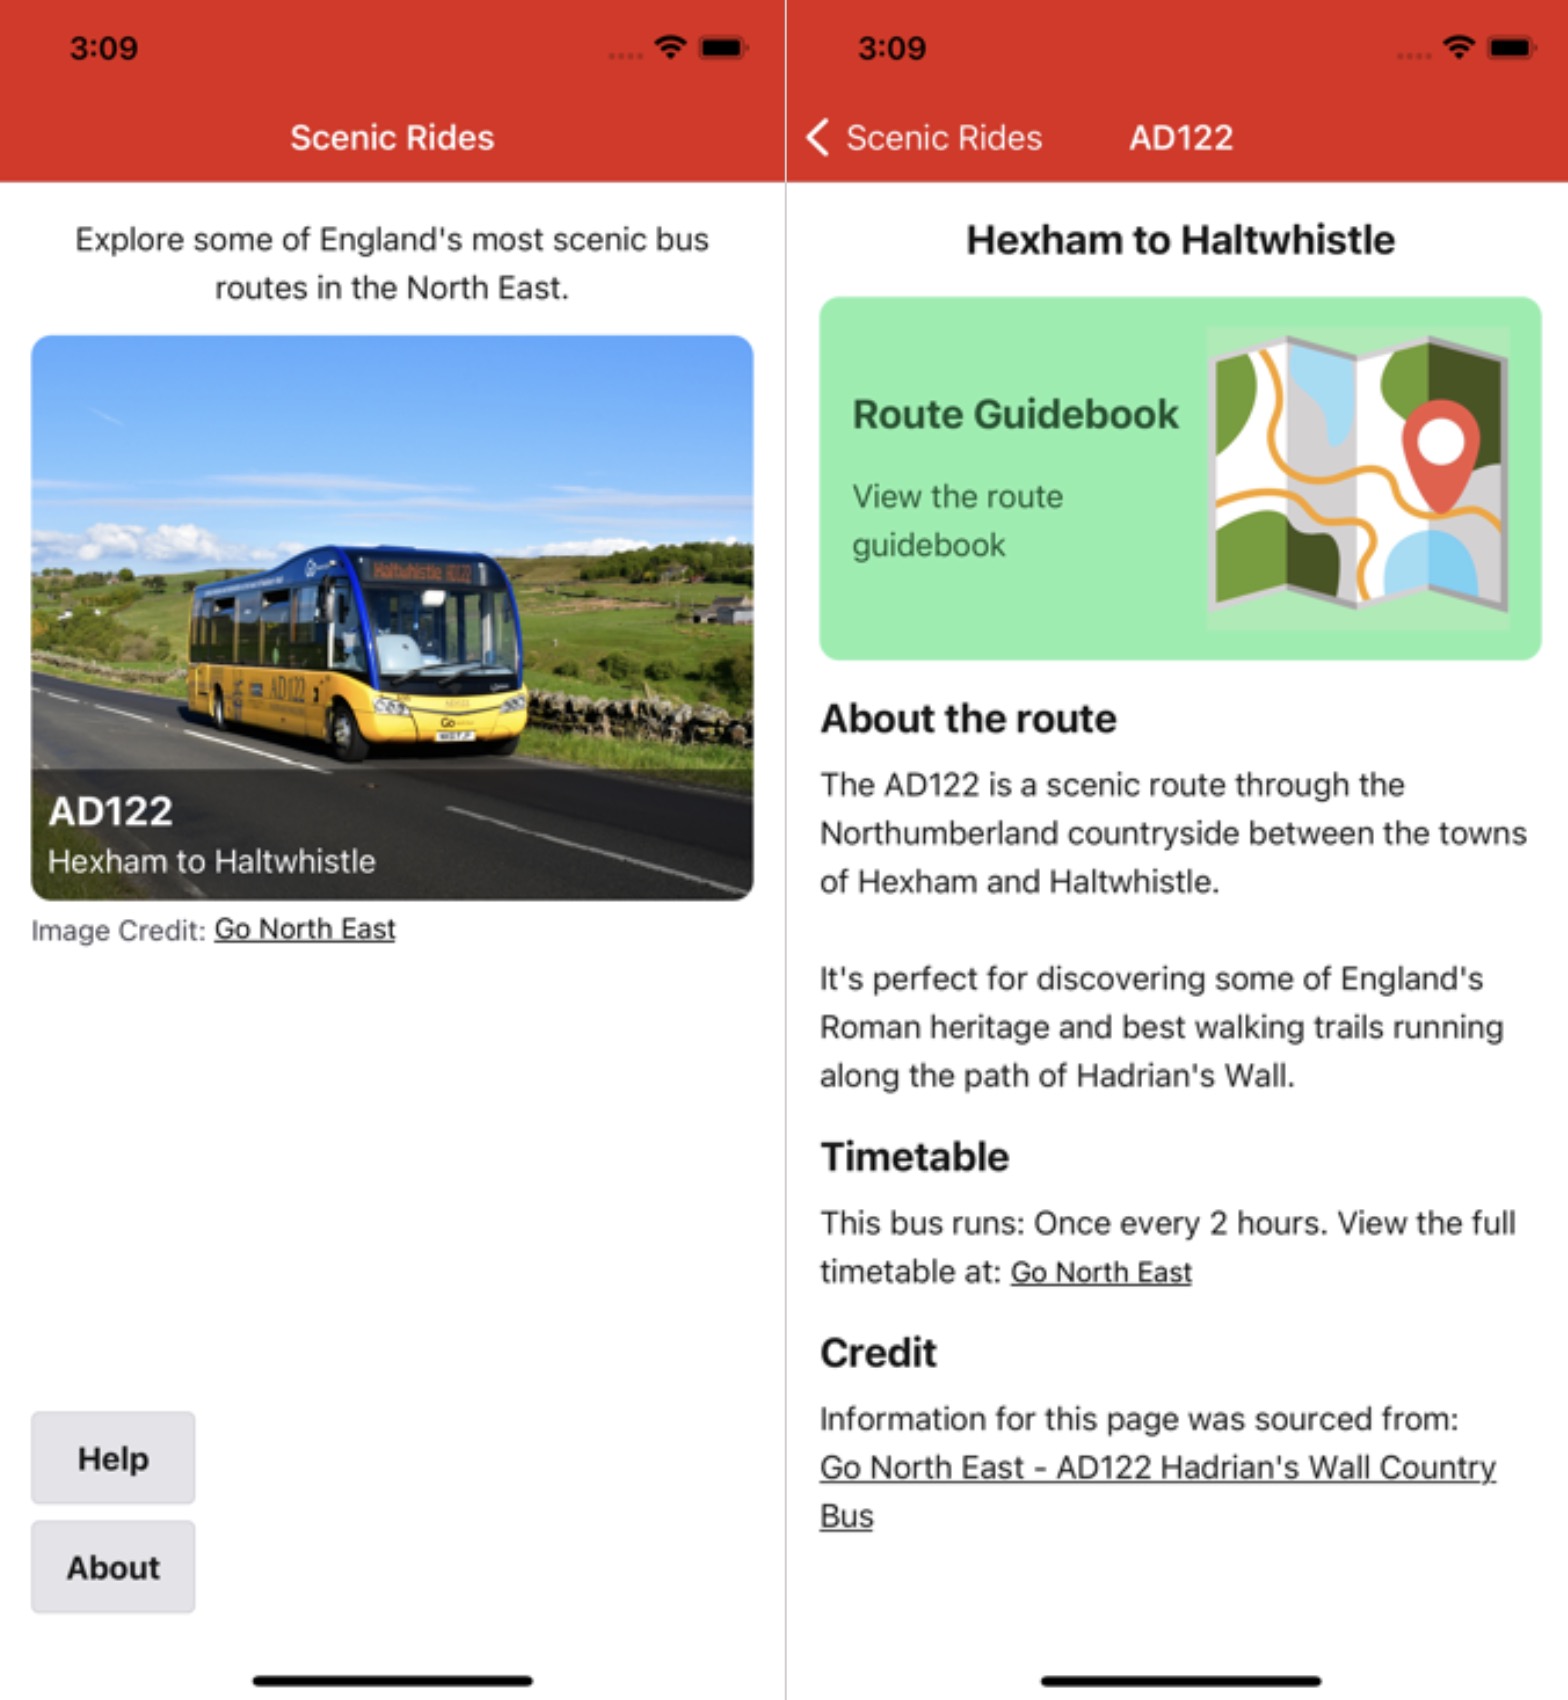
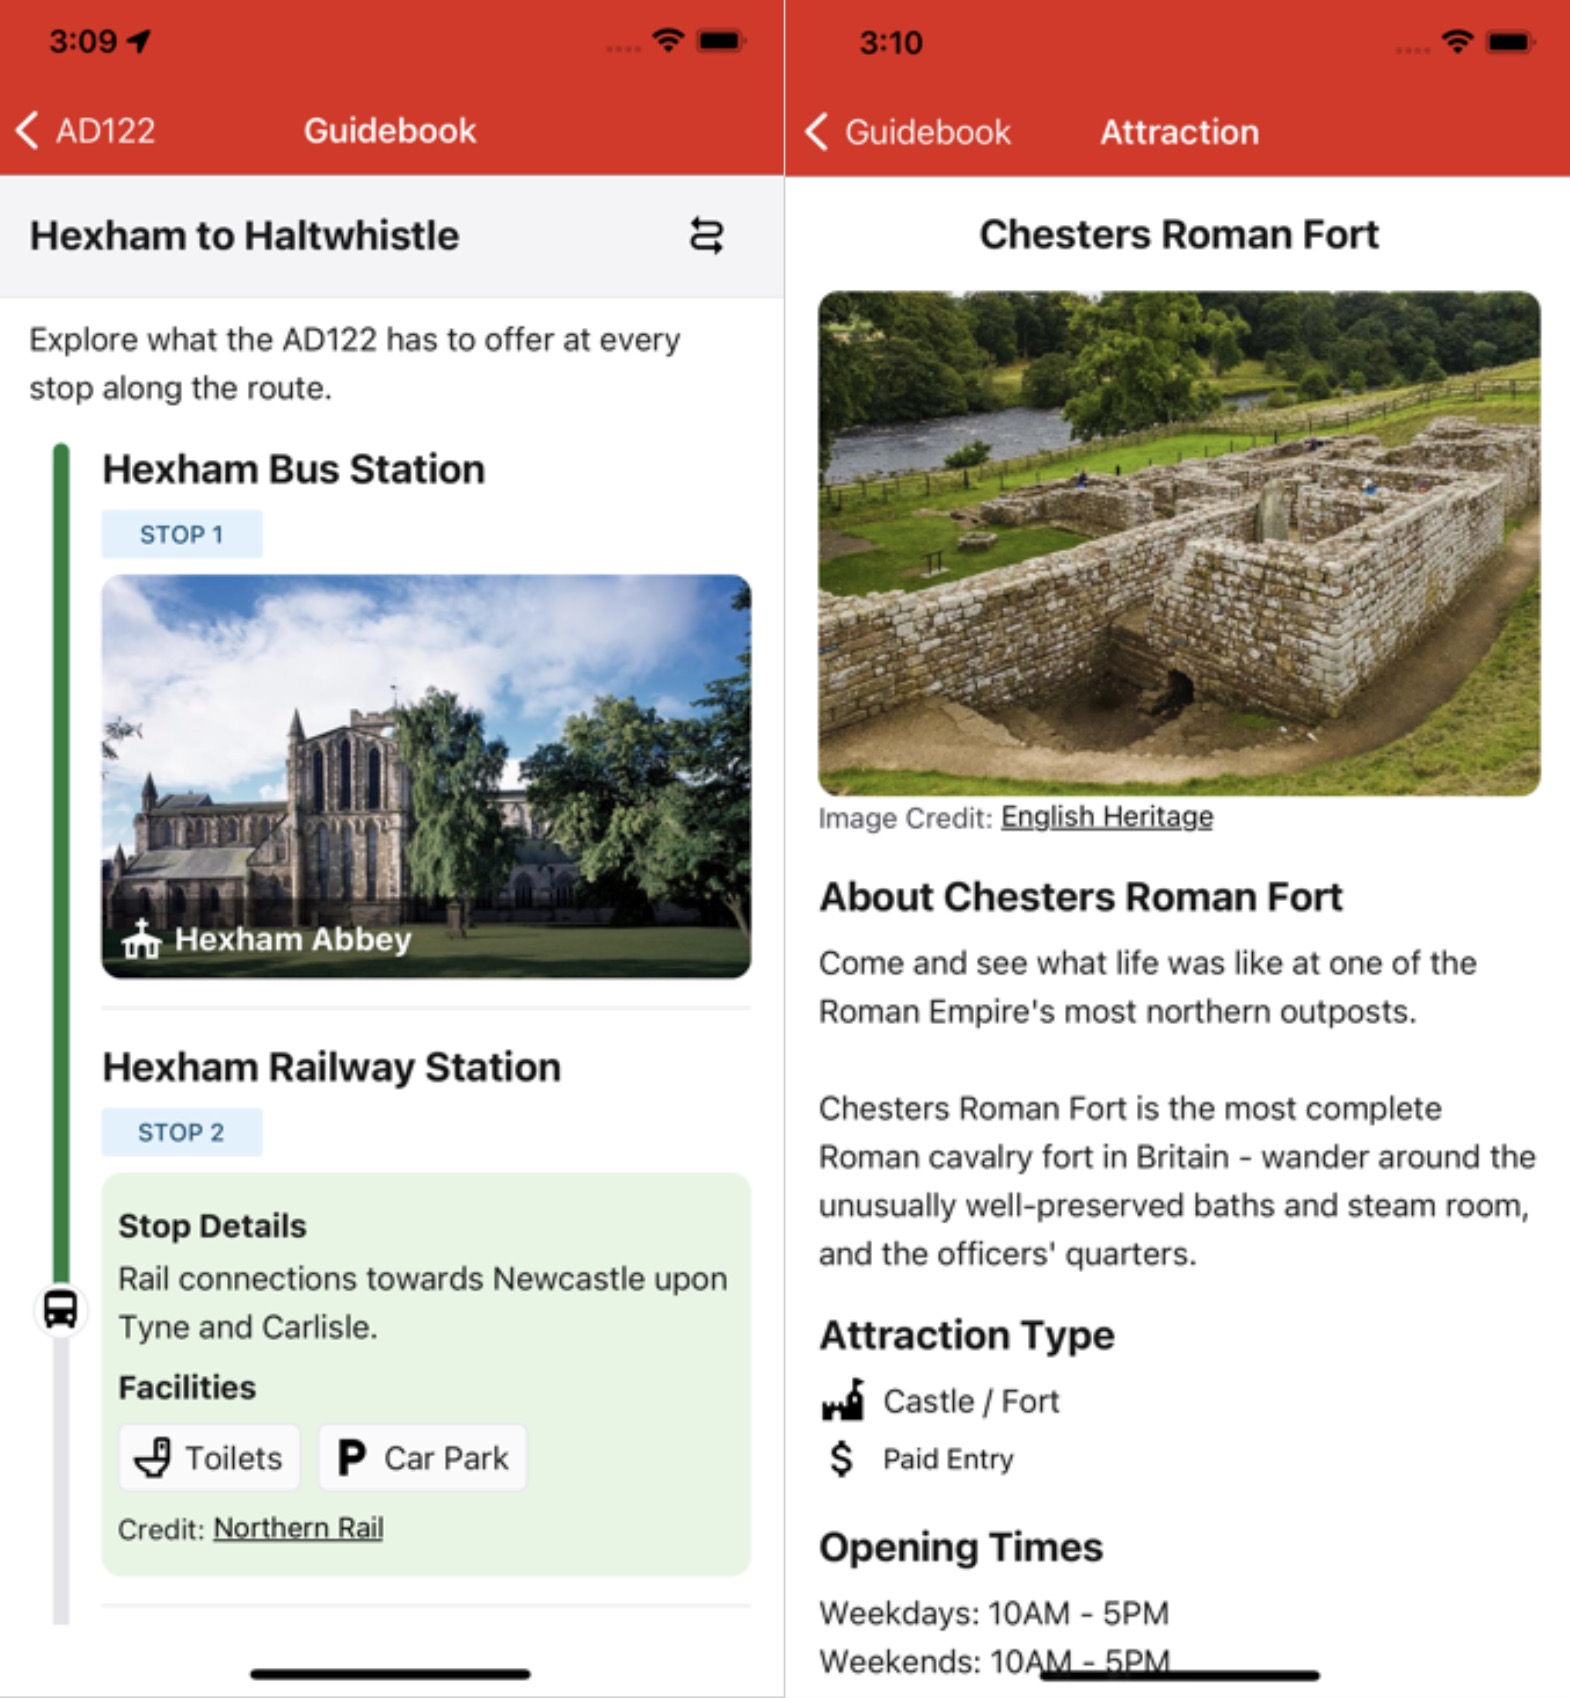
4.2 Testing Results
In this section the results of the testing completed in section 3.8 will be discussed, followed by a wider discussion of the finished project’s compliance with the requirements specification.
4.2.1 Results Achieved and Evaluation of Testing Methods
The overall results from testing were largely positive. Unit tests written for the application passed with a 100% pass rate, which provides reassurance that the application functions and data store is likely to be free from errors. One drawback to the approach taken with unit testing is that it excluded testing UI elements. A potential solution to this for future iterations of work would be to create snapshot tests (Expo, 2023c) which can be used to ensure the UI and individual components remain consistent, overall increasing test coverage.
Automated testing was successful in automating the process of mocking the bus route from start to finish without the need for in-person travel. This acted more as an aid to the development process rather than a pass/fail test, by helping to uncover bugs and inspect how the application UI responded in real-time to changing location positions. In this regard, this testing method was beneficial. On the other hand, the set-up of this test using a Python script specific to MacOS and Xcode on an individual device is not a transferable testing method that would work well if many developers were working on the project. An alternative solution for future work could be to use Jest to mock React state (specifically the geolocation state value in the Guidebook component) which would increase the portability of this testing process whilst achieving the same result.
System testing overall was highly useful, as it mimicked user journeys to evaluate if the application met its requirements. It was possible to evaluate the application’s success in completing tasks on various devices by comparing its response to the user’s actions with the expected outcome originally decided upon in the activity diagrams. The outcome of these tests demonstrated a high pass rate, with only minor bugs which could be fixed before the application was finalised.
4.2.2 Requirements Specification Compliance
Tables 6 & 7 detail the finished application’s compliance with the initial functional and non- functional requirements from section 3.2. Comments have been included to explain why the project did or did not achieve each requirement.
Table 6: Functional requirements compliance.
- FR1 - High Priority - PASS
- Comments: The home screen shows all available routes and links to the about and help screens.
- FR2 - High Priority - PASS
- Comments: Each route in the data file has a screen which is dynamically rendered for it containing details of the route and a link to its guidebook.
- FR3 - High Priority - PASS
- Comments: Each route will have a guidebook screen dynamically rendered.
- FR4 - High Priority - PASS
- Comments: The guidebook screen will show all stops and attractions for each route entered in the data files in a sequenced order.
- FR5 - High Priority - PASS
- Comments: The guidebook screen utilises geolocation features to show nearby stops and attractions to the user’s position.
- FR6 - High Priority - PASS
- Comments: The application requests permission from the user before using geolocation features.
- FR7 - High Priority - PASS
- Comments: The guidebook screen allows the user to switch the direction of travel and will function regardless of if geolocation permission is granted or denied.
- FR8 - High Priority - PASS
- Comments: Each attraction on the guidebook screen has a picture and name as set up in the data file for attractions.
- FR9 - High Priority - PASS
- Comments: Each attraction featured in the guidebook can be clicked on to navigate to its attraction screen.
- FR10 - High Priority - PARTIAL PASS
- Comments: Each attraction screen does contain an image and details about the attraction. However, this is marked as only partial as initial designs included a photo gallery (implying images rather than a singular image) which was not implemented due to the decision made to bundle static assets in the application binary.
- FR11 - High Priority - PASS
- Comments: Each piece of text, image, map, or other media was accredited back to its source using a link within the application.
- FR12 - Medium Priority - PASS
- Comments: Each bus stops on the route without an attraction includes details on the nearby area and facilities available at the stop.
- FR13 - Medium Priority - PASS
- Comments: The application functions if the user is not on the bus (i.e., standing at a stop). This was tested in the user evaluation of section 4.3.
- FR14 - Medium Priority - PARTIAL PASS
- Comments: The application does implement a static map on attraction screens; however, this is only marked as partial as the outcome of this implementation was lacking as will be covered in the following sections of the evaluation.
- FR15 - Low Priority - FAIL
- Comments: Push notification to alert users to nearby attractions was not implemented in the time available.
- FR16 - Low Priority - FAIL
- Comments: A favourites list of attractions was not implemented in the time available.
Table 7: Non-functional requirements compliance.
- NFR1 - High Priority - PASS
- Comments: React Native was used for the development of this application and it compiles to iOS and Android platforms successfully.
- NFR2 - High Priority - PASS
- Comments: Through using dynamic routing, reusable screen components, and separating the data from screens the app supports adding additional routes in the future without significant reengineering.
- NFR3 - High Priority - PASS
- Comments: The geolocation accuracy is set to high which works to within 10 meters, hence it locates users to the nearest stop or attraction.
- NFR4 - High Priority - PASS
- Comments: The application can run without any reliance on a network connection.
- NFR5 - High Priority - PASS
- Comments: A dataset of coordinate points was collected and used for the AD122 route to support functionality in this application.
- NFR6 - Medium Priority - PASS
- Comments: The guidebook screen in testing calculated the user location along the route in sub-2-second timing.
- NFR7 - Medium Priority - PASS
- Comments: Error screens and buttons linking to the homepage were created to provide concise error messaging and recovery for users.
Overall, the application achieved high compliance with the initial requirements. Two functional requirements failed due to not being implemented as the development time available ran out. However, these were both of low priority and could be considered additional features which were not essential to meeting the overall aims. Additionally, a partial pass was given to two functional requirements relating to the attractions screen that encompasses features where the implementation could be improved upon. All other requirements, functional and non-functional, passed.
4.3 User Evaluation
A user evaluation was conducted to gain external feedback on the finished application. This method of evaluation consisted of primary research involving participants who volunteered to use the application on the AD122 route and aimed to collect qualitative data which helps understand the users’ opinions. Participants were given a copy of Appendix 5, a guide sheet explaining the study and a questionnaire to fill out regarding the application. Furthermore, using the think-aloud protocol (Nielsen, 2012) participants were observed by the researcher and encouraged to discuss their answers to questions on the questionnaire. These observations will help in providing additional insights into the answers given by respondents.
The below points detail the specifications of the testing carried out:
- Date: 02 August 2023.
- Location: Testing took place between Hexham bus station and Haltwhistle railway station on the AD122 route.
- Time taken: In total, including time shortly before boarding and after departing the bus, testing took circa 1 hour and 30 minutes to complete.
- Number of participants: Two.
Table 8 details the topic of each question, followed by a discussion to rationalise the responses given by both participants. Original responses to the questionnaire have been included in Appendices 6 & 7.
Table 8: Summary of results from the user evaluation.
Q1. Initial thoughts and first-time use
Initial thoughts on the application were positive. Participant 1 focused on the design, liking the colours and images used, and describing it as “professional.” Whereas Participant 2 focused on the simplicity of the app making it easy to use and understand the purpose of.
Q2. Navigation and ease of use
Participants found navigation straightforward as there are not many click points, this meant they could easily use the app to find the information they needed quickly.
Q3. Good features of the application
Participant 1 commented on the app being highly visual through its use of images which helped them understand what was available on the route. Both participants commented on the “tracking screen” (i.e., guidebook screen) making it easy to know where you are on the route and what was around them. Furthermore, both participants valued information about stops and attractions as it consolidated information from many sources into one place, making it easy to find what they wanted.
Q4. Missing features
Both participants commented on the implementation of the mapping solution being poor. An interactive map would be the preferred option. Furthermore, Participant 2 felt the variety of attractions could be improved, specifically mentioning walking trails should be added.
Q5. Application design
The application design was well received, with strong points being the use of images and a bright and bold colour scheme. Participant 2 commented that the progress bar component is “quite unique.”
Q6. Errors, bugs, crashes, and other problems
Participant 1 noted a bug on the attraction screen as it was “never-ending” – on inspection, this bug was replicated as the attraction screen scrolls to a short void of white space. Secondly, Participant 2 noted an error between the stops The Sill and Vindolanda where the progress bar jumped between stops. An incident report on this issue has been included in Appendix 8 due to its severity.
Q7. Journey enhancements
The main enhancement to users’ journey on the bus was that it could be used to plan and find things to do on the route without needing to visit many separate websites/sources to find the information required.
Q8. When and how the application was used
Participant 1 liked the idea of using the application before going on the journey, as they could pre-plan their day out. Both participants said it was useful as a follow-along guide to see nearby attractions.
Q9. Use the application again.
Participant 1 was happy to use the application again noting it was “user-friendly” and “simple to use.” Participant 2 would use the application again but would like to see it expanded, such as containing more routes and a greater variety of attractions.
Q10. Would you recommend it?
Both participants noted they would be happy to recommend the application to friends and family, showing an overall positive experience.
4.4 Finished Application Merits
This section will reflect on the overall results and themes highlighted in the user feedback to discuss the standout merits of the finished application.
One of the application’s merits is its ease of use. Feedback suggested the application was easy to understand and function due to its simple design and structure. The participants liked that navigation was intuitive with large click points and buttons to go back and forth between screens. This benefited users by making information easy to find.
A second merit is the application’s design. The test users specifically liked the use of images which aided them in visualising what attractions had to offer. Participants described the UI as “professional,” whilst also having “unique” elements. Furthermore, the bright and bold colour scheme made the application inviting to use.
One of the most prominent merits of the application highlighted from feedback is its informational value. Participants loved how the application acted as an information hub for the route by consolidating content from a variety of sources into one place. This overall enhanced user’s experience of the bus journey by helping them easily plan their day and find out about points of interest, without the need to refer to many separate websites.
The final standout merit is the application’s route-tracking features. Participants enjoyed being able to interact with the app to view nearby bus stops and attractions to their location. This supports the case for a mobile solution in this market due to the benefits it can provide over a traditional paper guidebook.
4.5 Finished Application Limitations
This section will reflect on the limitations of the application which have been uncovered through testing and user feedback.
Firstly, the mapping solution on the attraction screens was executed poorly. The current implementation was decided upon to minimise network usage given the rural setting; however, it is clear from user feedback an interactive solution would be preferred. This would benefit the user by enabling them to explore the local area in greater depth compared to a static image. Therefore, this could be a piece of follow-on work for future iterations.
Secondly, as discovered by Participant 2 and investigated in the incident report of Appendix 8, additional work and logic will need to be implemented to solve the tracking bug where route sections overlap. Despite this only affecting a small portion of the route, it is important for this functionality to be correct as it is one of the most fundamental features of the application.
Finally, the content of the application would benefit from being expanded. Feedback suggested including additional types of attractions would give users a greater variety of choices. Furthermore, extra content on existing attractions could be included. For example, photo galleries over singular photos or videos to showcase attractions. This would aid in making the application more informative and appealing to a wider range of users.
4.6 Evaluation of Approaches Taken
This section of the evaluation will specifically cover the software engineering approaches taken in this project and discuss their benefits and drawbacks.
4.6.1 React Native and TypeScript
Overall, the decision to use React Native for this project was advantageous. It supports all features required by the application and remained performant throughout. The main benefit of this approach is that the application can be released to both iOS and Android markets, thus enabling the app to reach a larger audience. React Native empowers this all through a single codebase which streamlines the development process for creating mobile applications on multiple platforms. Utilising TypeScript over vanilla JavaScript has been further advantageous. TypeScript provided useful tooling and type hinting which helped detect errors and make sure safeguards (such as checking variables are defined or of the correct type) had been programmed into the application. One reflection on this approach is that using JavaScript classes instead of TypeScript type aliases would have been useful for validating data through custom constructor methods adding additional safeguards to the code.
4.6.2 Planning, Design and Agile Sprints
A strong point of the approach taken is that a large emphasis was placed on the planning and design processes before software development began. This included producing a comprehensive requirement specification, application designs, UML diagrams, and contemplating the logic required for the intended functionality. Because of this, sprints were highly focused, and features could be added with greater ease. The finished application reflects this in that it stays true to the initial software designs, demonstrating minimal deviations from the plan.
4.6.3 Data Store and Expandability
The decision to separate the application’s screens from the application’s data in a data store component was beneficial overall. This helped achieve one of the main aims of the project in ensuring it was expandable through reusable components. NFR2 set out that the application should support additional routes, even if only originally developed for the AD122. The result of this is demonstrated in Figures 76 & 77 whereby dummy data was briefly entered in the data file to act as a placeholder to test an example route. During this experiment, a second route was supported without any reengineering of components.
Figures 76 & 77: App with an additional example route.
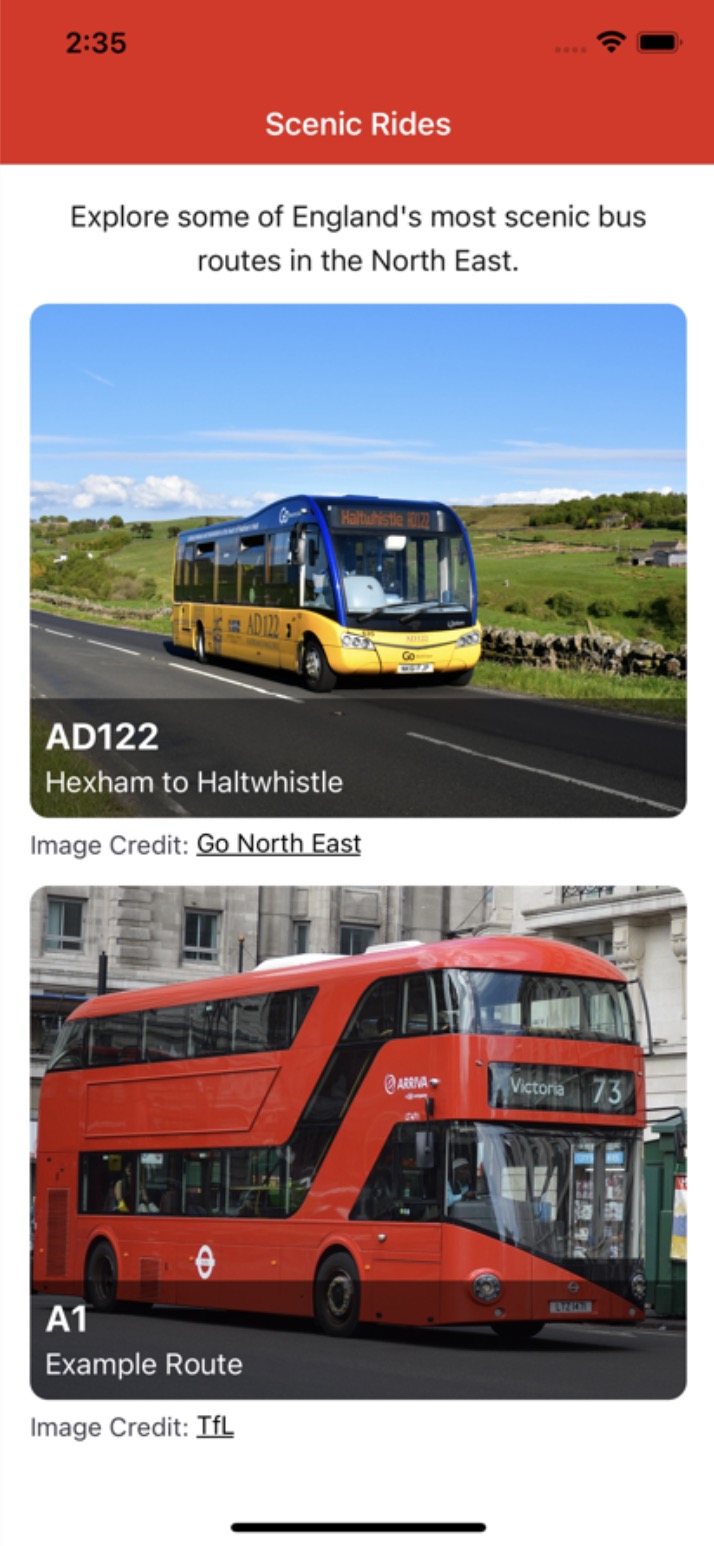
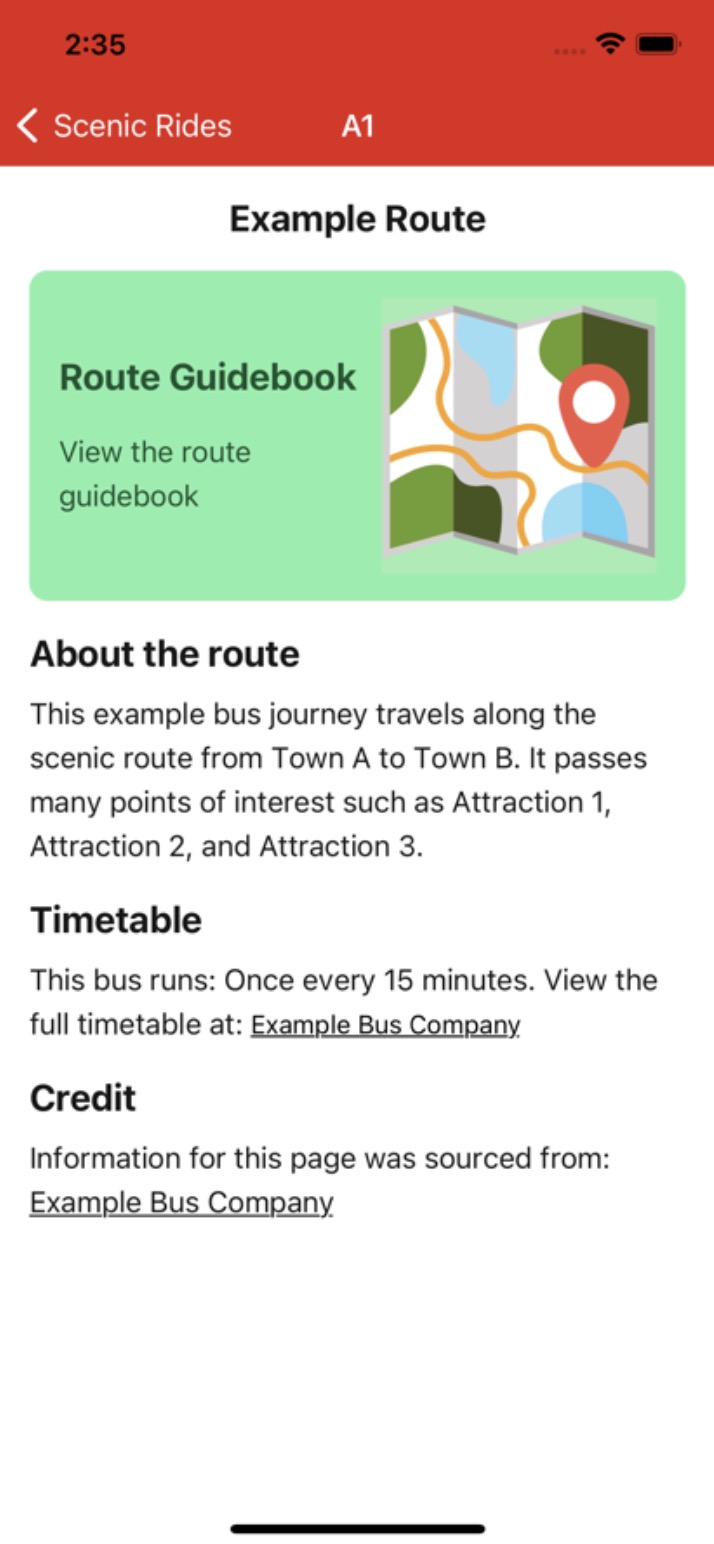
One downside to the approach taken with the data store is that there was some redundancy in the data collected. For example, the data file attractions.ts contains coordinate points of each attraction, however, these are unused variables in the codebase. Their inclusion does not cause any errors or bugs, but improved planning of the variables required could have saved development time in collecting unnecessary data points which was overall a largely manual and time-consuming process.
Secondly, the data store would benefit from stronger data validation. The approach used in storing data directly in a TypeScript file is mostly unvalidated and prone to developer errors such as mistyping a variable. Furthermore, some fields used such as bus route IDs and stop sequence numbers needed to act as primary and foreign keys to perform dynamic rendering in the React screens. As there are no constraints to ensure these values are correct, this approach could lead to errors in the software produced. In reflection, using technologies such as a relational database would be beneficial in introducing stricter data constraints and better support for fields that act as primary and foreign keys. A backend system which strongly validates data could be an advancement to the current implementation and will be discussed further in the conclusion regarding follow-on work for this project.
4.7 Evaluation Summary
This evaluation concludes having explored the results of testing, compliance with initial requirements and discussed user feedback on the application. It highlighted the strong and weak points of the app and the approaches taken in its development.
Chapter 5: Conclusions
Chapter 5 will aim to conclude the project by linking to the original objectives and aim. Furthermore, it will reflect on personal learnings and make recommendations for follow-on work.
5.1 Measurement of Project Objectives and Aim
Table 9 contains a discussion of how well the finished project met each initial objective set out in section 1.2.1.
Table 9: Discussion of project objectives.
- Objective: 1
- Achieved: Yes
- Discussion: The project conducted a study into 3 existing applications aimed at bus routes to explore their positives and negatives. Furthermore, bus routes in the North East were investigated to decide upon a suitable route.
- Objective: 2
- Achieved: Yes
- Discussion: Solutions for native and cross-platform mobile development technologies were analysed through a literature review, concluding React Native was the more desirable framework for this application.
- Objective: 3
- Achieved: Yes
- Discussion: Extensive planning was conducted leading to an initial set of requirements, UML diagrams of the system architecture, and mock-ups of the application design.
- Objective: 4
- Achieved: Yes
- Discussion: Following the plans produced, the mobile application was programmed in agile sprints which worked towards each requirement and objective.
- Objective: 5
- Achieved: Yes
- Discussion: The finalised application was tested using a variety of methods and evaluated by collecting user feedback and measuring the application against initial requirements.
To recap, the initial project aim was “to produce a mobile application that acts as a guide for passengers travelling on a scenic bus route located in the North East of England.” The project has delivered an application that takes material typically found in traditional guidebooks and presents it in an interactive mobile application. The underlying motivation for this project was to encourage travel on a bus route for the benefits it can generate for the cultural and heritage sectors. User feedback largely suggests this has been met due to the enhancements the application brought to a user’s journeys by acting as an informational hub for the bus route and route tracker to discover local attractions to visit. Therefore, it is possible to conclude the application successfully met its overall project aim, having also met each objective set out.
5.2 Personal Learnings
One personal learning from this project is how vast the software ecosystem is for mobile application development. There is a large variety of programming languages, frameworks, and tools that developers must learn and choose between. As a result, mobile developers must be knowledgeable of each technology to decide upon the best approach to take in developing their mobile application, rather than being prescribed a set of tools to use. Completing this project gave me hands-on experience in one solution, React Native, and led to me learning TypeScript. Consequently, the personal objectives set out in section 1.2.2 were successfully completed.
A second learning from this project is that programming is only a small piece of producing a finalised application. Additional steps such as research, planning, data collection, and content creation are equally important for meeting the user’s needs. Therefore, as a software engineer, it is important to understand these tasks must work in sync and not be ignored to produce a high-quality application overall.
5.3 Changes to My Approach
Based on personal learnings, if starting this or a similar project again, I would adjust the approach taken to offline technologies. Aiming for a strictly 100% offline application hindered the implementation of some features. Namely, as previously discussed, the execution of the mapping solution and limitations to the data store’s ability to validate data. The inclusion of online systems in the applications architecture could enhance both the apps’ features and functionality, whilst being cleverly integrated to minimise network usage where possible.
5.4 Areas for Future Research and Application Expansion
One option for expansion discussed previously is building a backend system for this application. This backend could act as a content management system for data points and route content. Mechanisms that ensure data integrity could be built in, such as a relational database and a web interface for managing routes which validates user input. Furthermore, this approach increases scalability over the current implementation, as additional routes and content can be added without changing the mobile application’s code. To support this option, the app was designed from the offset with dynamic rendering. Hence, it is theoretically possible to swap the current data store out for fetching JSON from a cloud API without significant changes to the existing application design. Further research into solutions for caching data from the backend locally on the user’s device to minimise network requests would complement this expansion.
Secondly, it would be valuable to expand upon the evaluation conducted to collect additional feedback on the finished application. One limitation of this study is that only two test users were recruited for the user evaluation, potentially leading to inconclusive results. A wider study involving many participants from different backgrounds would give greater confidence in the results obtained and support the conclusions made about the application produced. Furthermore, knowledgeable, and expert advice could be sought from specialists in the field. This could include collecting feedback from the bus operating company Go North East or professionals in mobile application development.
5.5 Concluding Statement
In summary, this dissertation has now discussed all stages involved in this project from initial planning and background research to implementation and evaluation. It concludes that the application produced successfully met its initial aims and objectives, as measured through testing against requirements and user evaluation. Furthermore, the merits and limitations of the app have been discussed, and follow-on work has been recommended to support the application’s expansion in the future.
References
- Adnan, M. and Khan, Z.A. (2010) Usability Evaluation of Web-based GIS Applications. Blekinge Institute of Technology. Available at: https://www.diva-portal.org/smash/get/diva2:832106/FULLTEXT01.pdf 🔗 (Accessed: 18 July 2023).
- Amazon Web Services (2023) What is Mobile Application Development? Available at: https://aws.amazon.com/mobile/mobile-application-development/ 🔗 (Accessed: 27 June 2023).
- Android Studio (n.d.) Download Android Studio & App Tools – Android Developers. Available at: https://developer.android.com/studio 🔗 (Accessed: 27 July 2023).
- Apple (n.d.) Apple Maps – Apple Developer. Available at: https://developer.apple.com/maps/ 🔗 (Accessed: 18 July 2023).
- Apple (2014) About Objective-C. Available at: https://developer.apple.com/library/archive/documentation/Cocoa/Conceptual/ProgrammingWithObjectiveC/Introduction/Introduction.html 🔗 (Accessed: 08 August 2023).
- Apple (2023) Xcode. Available at: https://developer.apple.com/documentation/xcode/ 🔗 (Accessed: 19 July 2023).
- Arriva (n.d.) Bus route and timetables: X18 Newcastle to Berwick. Available at: https://www.arrivabus.co.uk/find-a-service/x18-newcastle-to-berwick 🔗 (Accessed: 23 June 2023).
- Avenza Systems (2023) Avenza Maps: Offline Mapping (Version 5.0.0) [Mobile App]. Available at: https://apps.apple.com/gb/app/avenza-maps-offline-mapping/id388424049 🔗 (Accessed: 11 July 2023).
- Babel (2023) What is Babel? Available at: https://babeljs.io/docs/ 🔗 (Accessed: 19 July 2023).
- Big Bus Tours (2023) Big Bus Tours (Version 4.7.8) [Mobile App]. Available at: https://apps.apple.com/gb/app/big-bus-tours/id590746945 🔗 (Accessed: 24 June 2023).
- Canva (n.d.) Home – Canva. Available at: https://www.canva.com/ 🔗 (Accessed: 28 July 2023).
- Colblindor (n.d.) Coblis – Color Blindness Simulator. Available at: https://www.color-blindness.com/coblis-color-blindness-simulator/ 🔗 (Accessed: 11 August 2023).
- Colour Blind Awareness (n.d.) About Colour Blindness. Available at: https://www.colourblindawareness.org/colour-blindness/ 🔗 (Accessed: 28 July 2023).
- Dart (n.d.) Dart programming language. Available at: https://dart.dev/ 🔗 (Accessed: 08 August 2023).
- Draw.io (2023) draw.io. Available at: https://www.drawio.com/ 🔗 (Accessed: 13 July 2023).
- Dubner, S.J. and Levitt, S.D. (2008) ‘The Green Issue: Not-So-Free-Ride’, The New York Times, 20 April. Available at: https://www.nytimes.com/2008/04/20/magazine/20wwln-freakonomics-t.html 🔗 (Accessed: 18 July 2023).
- ECMAScript (2023) ECMAScript 2024 Language Specification. Available at: https://tc39.es/ecma262/ 🔗 (Accessed: 08 August 2023).
- English Heritage (n.d.) About Us – English Heritage. Available at: https://www.english-heritage.org.uk/about-us/ 🔗 (Accessed: 31 July 2023).
- Expo (n.d.) Expo Home Page. Available at: https://expo.dev/home 🔗 (Accessed: 18 July 2023).
- Expo (2022) Offline Support. Available at: https://docs.expo.dev/archive/classic-updates/offline-support/ 🔗 (Accessed: 18 July 2023).
- Expo (2023a) Expo – Use TypeScript. Available at: https://docs.expo.dev/guides/typescript/ 🔗 (Accessed: 29 June 2023).
- Expo (2023b) Expo Location. Available at: https://docs.expo.dev/versions/latest/sdk/location/ 🔗 (Accessed: 29 July 2023).
- Expo (2023c) Unit testing. Available at: https://docs.expo.dev/develop/unit-testing/ 🔗 (Accessed: 04 August 2023).
- Flutter (n.d.) Flutter – Build apps for any screen. Available at: https://flutter.dev/ 🔗 (Accessed: 27 June 2023).
- GISGeography (2022) World Geodetic System (WGS84). Available at: https://gisgeography.com/wgs84-world-geodetic-system/ 🔗 (Accessed: 18 July 2023).
- Git (n.d.) Git. Available at: https://git-scm.com/ 🔗 (Accessed: 19 July 2023).
- GitHub (n.d.) GitHub. Available at: https://github.com/ 🔗 (Accessed: 19 July 2023).
- Google (2023a) An image format for the Web. Available at: https://developers.google.com/speed/webp 🔗 (Accessed: 03 August 2023).
- Google (2023b) cwebp. Available at: https://developers.google.com/speed/webp/docs/cwebp 🔗 (Accessed: 03 August 2023).
- Google Earth Outreach (n.d.) Visualise your data on a custom map using Google My Maps. Available at: https://www.google.com/earth/outreach/learn/visualize-your-data-on-a-custom-map-using-google-my-maps/#let-s-get-started-0 🔗 (Accessed: 13 July 2023).
- Google Maps Platform (n.d.) Google Maps Platform. Available at: https://developers.google.com/maps 🔗 (Accessed: 18 July 2023).
- Google Maps Platform (2023) Map and Tile Coordinates. Available at: https://developers.google.com/maps/documentation/javascript/coordinates 🔗 (Accessed: 18 July 2023).
- Google My Maps (n.d.) My Maps – About – Google Maps. Available at: https://www.google.co.uk/maps/about/mymaps/ 🔗 (Accessed: 13 July 2023).
- Go North East (n.d.) AD122 Hadrian’s Wall Country Bus. Available at: https://www.gonortheast.co.uk/ad122/ 🔗 (Accessed: 23 June 2023).
- Go North East (2023) AD122 Hexham – Haltwhistle from 27 May 2023. Available at: https://passenger-line-assets.s3.eu-west-1.amazonaws.com/gonortheast/GNE/AD12-timetable-20230527-4b0e9db4.pdf 🔗 (Accessed: 14 July 2023).
- Information Commissioner’s Office (n.d.) Location data. Available at: https://ico.org.uk/for-organisations/direct-marketing-and-privacy-and-electronic-communications/guide-to-pecr/communications-networks-and-services/location-data/ 🔗 (Accessed: 29 July 2023).
- Jest (n.d.) Jest – Delightful JavaScript Testing. Available at: https://jestjs.io/ 🔗 (Accessed: 19 July 2023).
- Jest (2023a) Getting Started. Available at: https://jestjs.io/docs/getting-started 🔗 (Accessed: 04 August 2023).
- Jest (2023b) Using Matchers. Available at: https://jestjs.io/docs/using-matchers 🔗 (Accessed: 04 August 2023).
- JetBrains (n.d.) Kotlin Programming Language. Available at: https://kotlinlang.org/ 🔗 (Accessed: 08 August 2023).
- JSDoc (n.d.) Use JSDoc. Available at: https://jsdoc.app/index.html 🔗 (Accessed: 03 August 2023).
- JSON (n.d.) JSON. Available at: https://www.json.org/json-en.html 🔗 (Accessed: 29 July 2023).
- Liew, Z. (2019) Seeding a database. Available at: https://zellwk.com/blog/seed-database/ 🔗 (Accessed: 18 July 2023).
- McWherter, J. and Gowell, S. (2012) Professional Mobile Application Development. 1st edn. Indianapolis: John Wiley & Sons.
- Millington, S. (2022) A Solid Guide to SOLID Principles. Available at: https://www.baeldung.com/solid-principles 🔗 (Accessed: 18 July 2023).
- Movable Type (n.d.) Calculate distance, bearing and more between Latitude/Longitude points. Available at: http://www.movable-type.co.uk/scripts/latlong.html 🔗 (Accessed: 29 July 2023).
- Mozilla (2023a) Geolocation API. Available at: https://developer.mozilla.org/en-US/docs/Web/API/Geolocation_API 🔗 (Accessed: 18 July 2023).
- Mozilla (2023b) JavaScript data types and data structures. Available at: https://developer.mozilla.org/en-US/docs/Web/JavaScript/Data_structures 🔗 (Accessed: 19 July 2023).
- Native Base (n.d.) Native Base: Universal Components for React & React Native. Available at: https://nativebase.io/ 🔗 (Accessed: 29 June 2023).
- Native Base (2022) Customizing Theme. Available at: https://docs.nativebase.io/customizing-theme 🔗 (Accessed: 21 July 2023).
- Naumov, A. (2020) Separation of Concerns in Software Design. Available at: https://nalexn.github.io/separation-of-concerns/ 🔗 (Accessed: 18 July 2023).
- Nielsen, J. (2012) Thinking Aloud: The #1 Usability Tool. Available at: https://www.nngroup.com/articles/thinking-aloud-the-1-usability-tool/ 🔗 (Accessed: 05 August 2023).
- Northumberland Coast AONB (2020) Northumberland Coast Visitors Guide Area of Outstanding Natural Beauty. Stocksfield: Offstone Publishing.
- npm (n.d.) About npm. Available at: https://www.npmjs.com/about 🔗 (Accessed: 19 July 2023).
- Olsina, L., Pastor, O., Rossi, G. and Schwabe, D. (2008) Web Engineering: Modelling and Implementing Web Applications. 1st edn. London: Springer London.
- OpenStreetMap (n.d.) About – OpenStreetMap. Available at: https://www.openstreetmap.org/about 🔗 (Accessed: 18 July 2023).
- Oracle (n.d.) Java. Available at: https://www.java.com/en/ 🔗 (Accessed: 08 August 2023).
- Prettier (n.d.) Prettier – Opinionated Code Formatter. Available at: https://prettier.io/ 🔗 (Accessed: 19 July 2023).
- Randhawa, T.S. (2022) Mobile Applications Design, Development and Optimization. 1st edn. Cham: Springer Nature Switzerland.
- React (2022) Glossary of React Terms. Available at: https://legacy.reactjs.org/docs/glossary.html 🔗 (Accessed: 19 July 2023).
- React (2023a) Writing Markup with JSX. Available at: https://react.dev/learn/writing-markup-with-jsx 🔗 (Accessed: 18 July 2023).
- React (2023b) Your First Component. Available at: https://react.dev/learn/your-first-component 🔗 (Accessed: 19 July 2023).
- React Native (n.d.) React Native. Available at: https://reactnative.dev/ 🔗 (Accessed: 27 June 2023).
- React Native (2023a) Using TypeScript. Available at: https://reactnative.dev/docs/typescript 🔗 (Accessed: 19 July 2023).
- React Native (2023b) Setting up the development environment. Available at: https://reactnative.dev/docs/environment-setup 🔗 (Accessed: 29 June 2023).
- React Native (2023c) ScrollView. Available at: https://reactnative.dev/docs/scrollview 🔗 (Accessed: 30 July 2023).
- React Navigation (2022a) Type checking with TypeScript. Available at: https://reactnavigation.org/docs/typescript/ 🔗 (Accessed: 20 July 2023).
- React Navigation (2022b) Themes. Available at: https://reactnavigation.org/docs/themes/ 🔗 (Accessed: 21 July 2023).
- React Navigation (2023a) React Navigation – Getting Started. Available at: https://reactnavigation.org/docs/getting-started 🔗 (Accessed: 29 June 2023).
- React Navigation (2023b) React Navigation – Hello React Navigation. Available at: https://reactnavigation.org/docs/hello-react-navigation 🔗 (Accessed: 29 June 2023).
- React Navigation (2023c) React Navigation – Navigation events. Available at: https://reactnavigation.org/docs/navigation-events/ 🔗 (Accessed: 29 July 2023).
- Scenic Buses (n.d.) Join Scenic Buses now and reach thousands of scenic bus passengers every single week. Available at: https://scenicbuses.uk/enroll/ 🔗 (Accessed: 22 June 2023).
- Scenic Buses (2022) Scenic Buses is award winning at the Euro Bus Expo 2022 Innovation Challenge! Available at: https://scenicbuses.uk/scenic-buses-is-award-winning-at-the-euro-bus-expo-2022-innovation-challenge/ 🔗 (Accessed: 19 June 2023).
- SQLite (n.d.) SQLite Home Page. Available at: https://www.sqlite.org/index.html 🔗 (Accessed: 18 July 2023).
- Swift (n.d.) Welcome to Swift.org. Available at: https://www.swift.org/ 🔗 (Accessed: 08 August 2023).
- Taplin, P. (2023) ‘Seven of England’s most scenic bus routes’, The Times, 31 January. Available at: https://www.thetimes.co.uk/article/best-scenic-prettiest-bus-journeys-in-england-qx99j96vt 🔗 (Accessed: 23 June 2023).
- Tootbus (n.d.) Best and simplest way to discover cities | Tootbus. Available at: https://www.tootbus.com/en 🔗 (Accessed: 27 June 2023).
- Tootbus (2023) Tootbus – City Guide (Version 2.0.8) [Mobile App] Available at: https://apps.apple.com/gb/app/tootbus-city-guide/id1539663642 🔗 (Accessed: 27 June 2023).
- Transport for London (2022) Colour standard: Issue 8. Available at: https://content.tfl.gov.uk/tfl-colour-standard-issue-08.pdf 🔗 (Accessed: 29 June 2023).
- TypeScript (2023) TypeScript: JavaScript with syntax for types. Available at: https://www.typescriptlang.org/ 🔗 (Accessed: 19 July 2023).
- Vanderjack, B. (2015) The Agile Edge: Managing Projects Effectively Using Agile Scrum. 1st edn. New York: Business Expert Press.
- Visual Studio Code (2023) Visual Studio Code – Code editing. Redefined. Available at: https://code.visualstudio.com/ 🔗 (Accessed: 19 July 2023).
- W3C (2023) Permissions. Available at: https://www.w3.org/TR/permissions/#dfn-express-permission 🔗 (Accessed: 18 July 2023).
- W3Schools (n.d.) TypeScript Type Aliases and Interfaces. Available at: https://www.w3schools.com/typescript/typescript_aliases_and_interfaces.php 🔗 (Accessed: 19 July 2023).
- Wasserman, A.I. (2010) ‘Software engineering issues for mobile application development’, In Proceedings of the FSE/SDP workshop on Future of software engineering research (FoSER ‘10), pp. 397 – 400. Available at: https://doi.org/10.1145/1882362.1882443 🔗.
- World Wide Web Consortium (2023) Geolocation API. Available at: https://w3c.github.io/geolocation-api/ 🔗 (Accessed: 18 July 2023).
Appendices
Appendix 1: Glossary of Technical Terms and Abbreviations
Appendix 1 is a glossary of technical terms and abbreviations used within this dissertation and their associated meaning.
- Android - Android is a popular mobile operating system which is open-source and owned by Google.
- API -API, an abbreviation for Application Programming Interface, is a protocol which sets rules for how two systems can communicate with each other.
- Backend - A backend system is one which typically runs on a server, instead of on the user device (as opposed to a frontend system). Examples include APIs and database systems.
- Bridge - A bridge, or bridging, in React Native refers to interfaces which enable a cross-platform codebase to communicate and exchange data with native iOS and Android modules.
- Bundle - A mobile applications bundle is the packaged software released to the end-user, typically downloaded through the platform’s app store.
- Caching - Caching refers to storing data in easily accessible memory so the application can access it faster. Typically, an expensive process (e.g., one which takes a lot of computation) would be cached to save recomputing the result.
- CMS - CMS, short for Content Management System, is typically a cloud service or system which enables users to easily manage the content or data of a service without a need to write it in code.
- CSS - CSS (Cascading Style Sheets) is the language used to for styling and presentation of HTML documents.
- Dart - Dart is a programming language developed by Google typically used in mobile and web programs.
- Database -A database is form of storing data in a structured format, such as a relational database which stores data in columns and rows.
- Emulator - An emulator, also referred to as a simulator, is a piece of software which runs a mobile phone of varying hardware/software configurations directly on a developer’s machine.
- Flutter - Flutter is an open-source framework for cross-platform mobile application development created by Google.
- HTML - HTML (HyperText Markup Language) is a markup language which defines the structure and elements of a webpage.
- IDE - IDE (Integrated Development Environment) are programs aimed at improving the experience of writing code for software engineers. They provide useful tooling such as built-in terminals, code completion, type hinting, etc.
- iOS - iOS is the popular mobile operating systems for iPhone developed by
- Java - Java is an object orientated programming language.
- JavaScript - JavaScript is the default programming language for web environments, it supports both object orientated and functional patterns.
- JSON - JSON (JavaScript Object Notation) is a standardised format for representing data as JavaScript Objects.
- JSX - JSX, is a syntax extension to JavaScript, which enable developers to write HTML combined with full JavaScript code to create dynamic and stateful web interfaces.
- Kotlin - Kotlin is a programming language built off Java and the Java Virtual Machine.
- Native Application - A native application is one which is designed to work on a specific platform or operating system.
- Objective-C - Objective-C is a programming language which adds object-oriented patterns to the C language.
- React - React is a frontend JavaScript library, open-sourced by Meta, for building web interfaces.
- React Native - React Native is a mobile application development cross-platform framework for building apps for iOS, Android, and the web. It utilises many features from React.
- REST API - REST (Representational State Transfer) APIs are a standardised set of rules for building RESTful web services.
- SDK - SDKs, short for Software Development Kits, are a set of tools for building software.
- Swift - Swift is a programming language developed by Apple used in the development of software for iOS and other Apple platforms.
- Toolchain - A toolchain in software development is a set of tools or software to aid in the development process.
- TypeScript - TypeScript is an extension to the JavaScript programming language developed by Microsoft which adds static typing to JavaScript syntax. UI, short for
- UI - User Interface, is the device screen or mechanisms by which a user interacts with a device and the software.
- UML - UML (Unified Modelling Language) is a means to standardise the representation of software systems through diagrams.
Appendix 2: Developer Documentation
Appendix 2 is the documentation for the project aimed at software developers.
Running the Project
The below sections detail commands which are required to run the project from the command line. Commands listed are contained within backtick characters (`).
Prerequisites
Before running the project, you must have the core dependencies installed on your development machine. This includes Node.js 🔗 and a smartphone emulator/simulator, either Xcode 🔗 for iOS or Android Studio 🔗 for Android.
Before the project can be run, the command npm install should be run to install node modules specified in package.json.
Development Environment
To start a development environment, first, ensure an emulator is open, then run one of the following commands:
- Android:
npm run android - iOS:
npm run ios
Alternatively, in place of an emulator, the Expo Go mobile application 🔗 can be connected to a running project to view the application on a real mobile device.
Testing the Project
The project has a set of Jest unit tests configured which can be run using the following command: npm test.
An automated test can be run to control the device’s location settings through the Xcode simulator. This loops through all coordinates for the AD122 route to mimic being on the bus. This test file is located in ./automated_testing/location_simulation.py and is a standalone Python script file. It is designed specifically for MacOS and Xcode, use python location_simulation.py from the automated testing directory to run it.
Building the Application
Full documentation for building an Expo React Native application is located at https://docs.expo.dev/build/setup/ 🔗. A summary of instructions is provided below:
- Install the EAS CLI:
npm install -g eas-cli - Log in to an Expo account:
eas login - Configure the build:
eas build:configure - Run one of the following build commands:
- All platforms:
eas build –-platform all - Android only:
eas build –-platform android - iOS only:
eas build –-platform ios(Note: this option requires a paid Apple Developer account to complete).
- All platforms:
- Deploy to an app store or run locally on an emulator:
- Run the build on an Android emulator:
eas build:run -p android
- Run the build on an Android emulator:
Configuration Files
The below points detail configuration files in the root directory and their use cases.
.gitignore– local files/folders to be ignored from committing to the git repository..prettierignore– files/folders to be ignored from formatting with prettier..prettierrc.js– prettier configuration file. Specifies how the source code should be automatically formatted.app.json– Expo and React Native project configuration.babel.config.js– configuration for babel transpiler.eas.json– project build configurations.jest.config.js– Jest test configuration file.package.json– node package manager dependencies and script configuration.tsconfig.json– configuration of TypeScript options for the project.
Data Store Schema
The data store refers to a set of TypeScript seed files containing the data and content for the application located in ./src/data/.
Attractions Data
The file attractions.ts contains data on attractions for bus routes. It exports a JavaScript object attractionData which is an array of type BusRoute.
A BusRoute should contain the following fields:
| Field | Description |
|---|---|
id
|
|
totalAttractions
|
|
attractions
|
|
An Attraction should contain the following fields:
| Field | Description |
|---|---|
id
|
|
name
|
|
icon
|
|
nearestStop
|
|
coordinates
|
|
image
|
|
map
|
|
description
|
|
freeEntry
|
|
openingTimes
|
|
contactDetails
|
|
credits
|
|
An OpeningTimes should contain the following fields:
| Field | Description |
|---|---|
weekday
|
|
weekend
|
|
other
|
|
A ContactDetails should contain the following fields:
| Field | Description |
|---|---|
phone
|
|
email
|
|
address
|
|
Bus Routes Data
The file busRoutes.ts contains data on bus routes. It exports a JavaScript object busRoutesData which is an array of type BusRoute.
A BusRoute should contain the following fields:
| Field | Description |
|---|---|
id
|
|
name
|
|
origin
|
|
destination
|
|
image
|
|
description
|
|
frequency
|
|
timetable
|
|
credits
|
|
Bus Stops Data
The file busStops.ts contains data on bus stops located on a bus route. It exports a JavaScript object stopsData which is an array of type BusRoute.
A BusRoute should contain the following fields:
| Field | Description |
|---|---|
id
|
|
totalStops
|
|
stops
|
|
A BusStop should contain the following fields:
| Field | Description |
|---|---|
sequence
|
|
name
|
|
lat
|
|
long
|
|
nearestPoint
|
|
details
|
|
facilities
|
|
attractions
|
|
Route Points Data
The file routePoints.ts contains data on coordinate points located on a bus route. It exports a JavaScript object routePoints which is an array of type BusRoute.
A BusRoute should contain the following fields:
| Field | Description |
|---|---|
id
|
|
points
|
|
A BusRoutePoint should contain the following fields:
| Field | Description |
|---|---|
sequence
|
|
Coordinate
|
|
Appendix 3: Failed Test Case
Appendix 3 shows the result of a failed test case on a Pixel 6 device whereby the image sizing was incorrect for the device width. This bug was fixed before finalising the application.
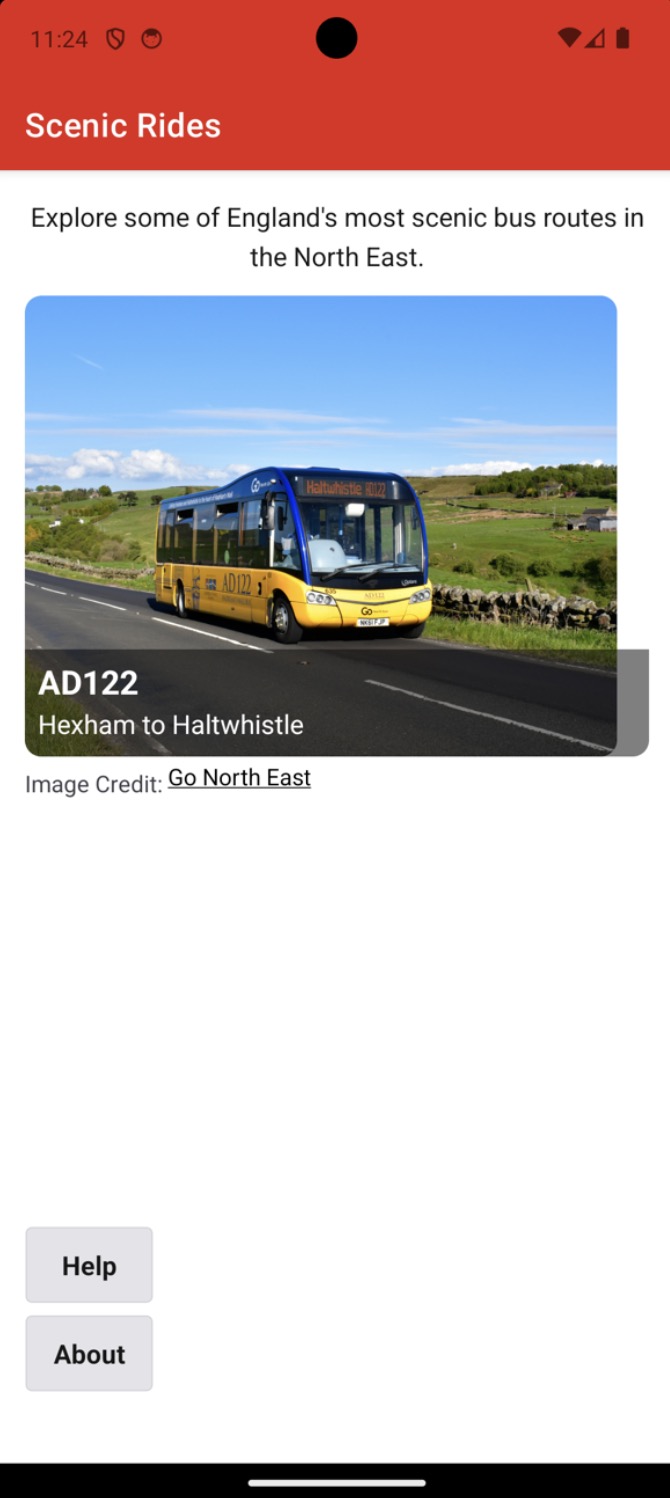
Appendix 4: Colour Blindness Test Results
Appendix 4 contains images showing the results of the completed colour blindness test. The tool used to complete the test was “Coblis – Color Blindness Simulator” (Colblindor, n.d.). Each screen undertook four tests: red-blind (Protanopia), green-blind (Deuteranopia), blue- blind (Tritanopia), and monochromacy (Achromatopsia). Images below are laid out in this respective order.
Home Screen
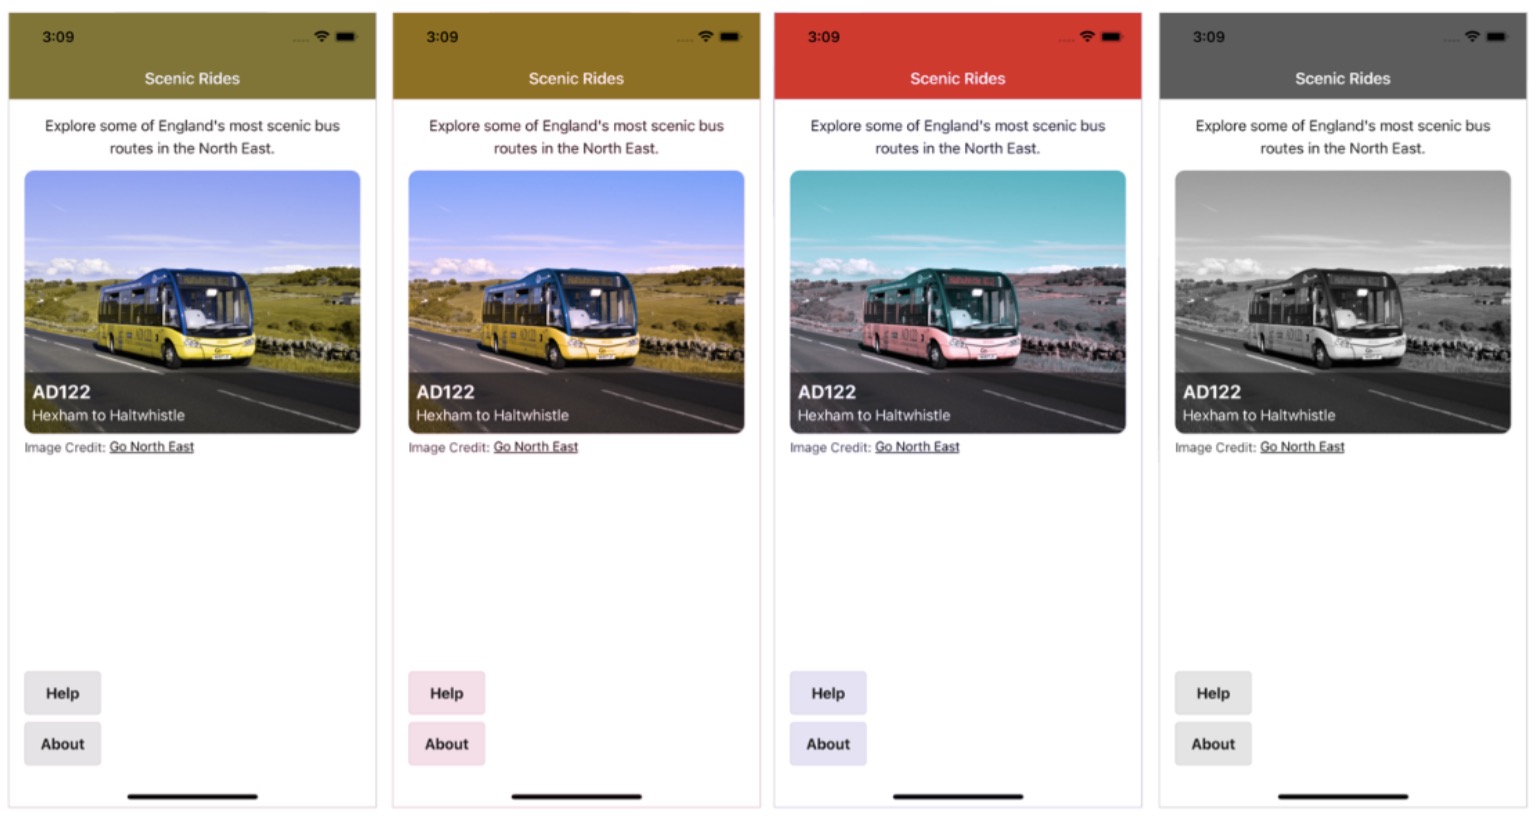
Bus Route Screen
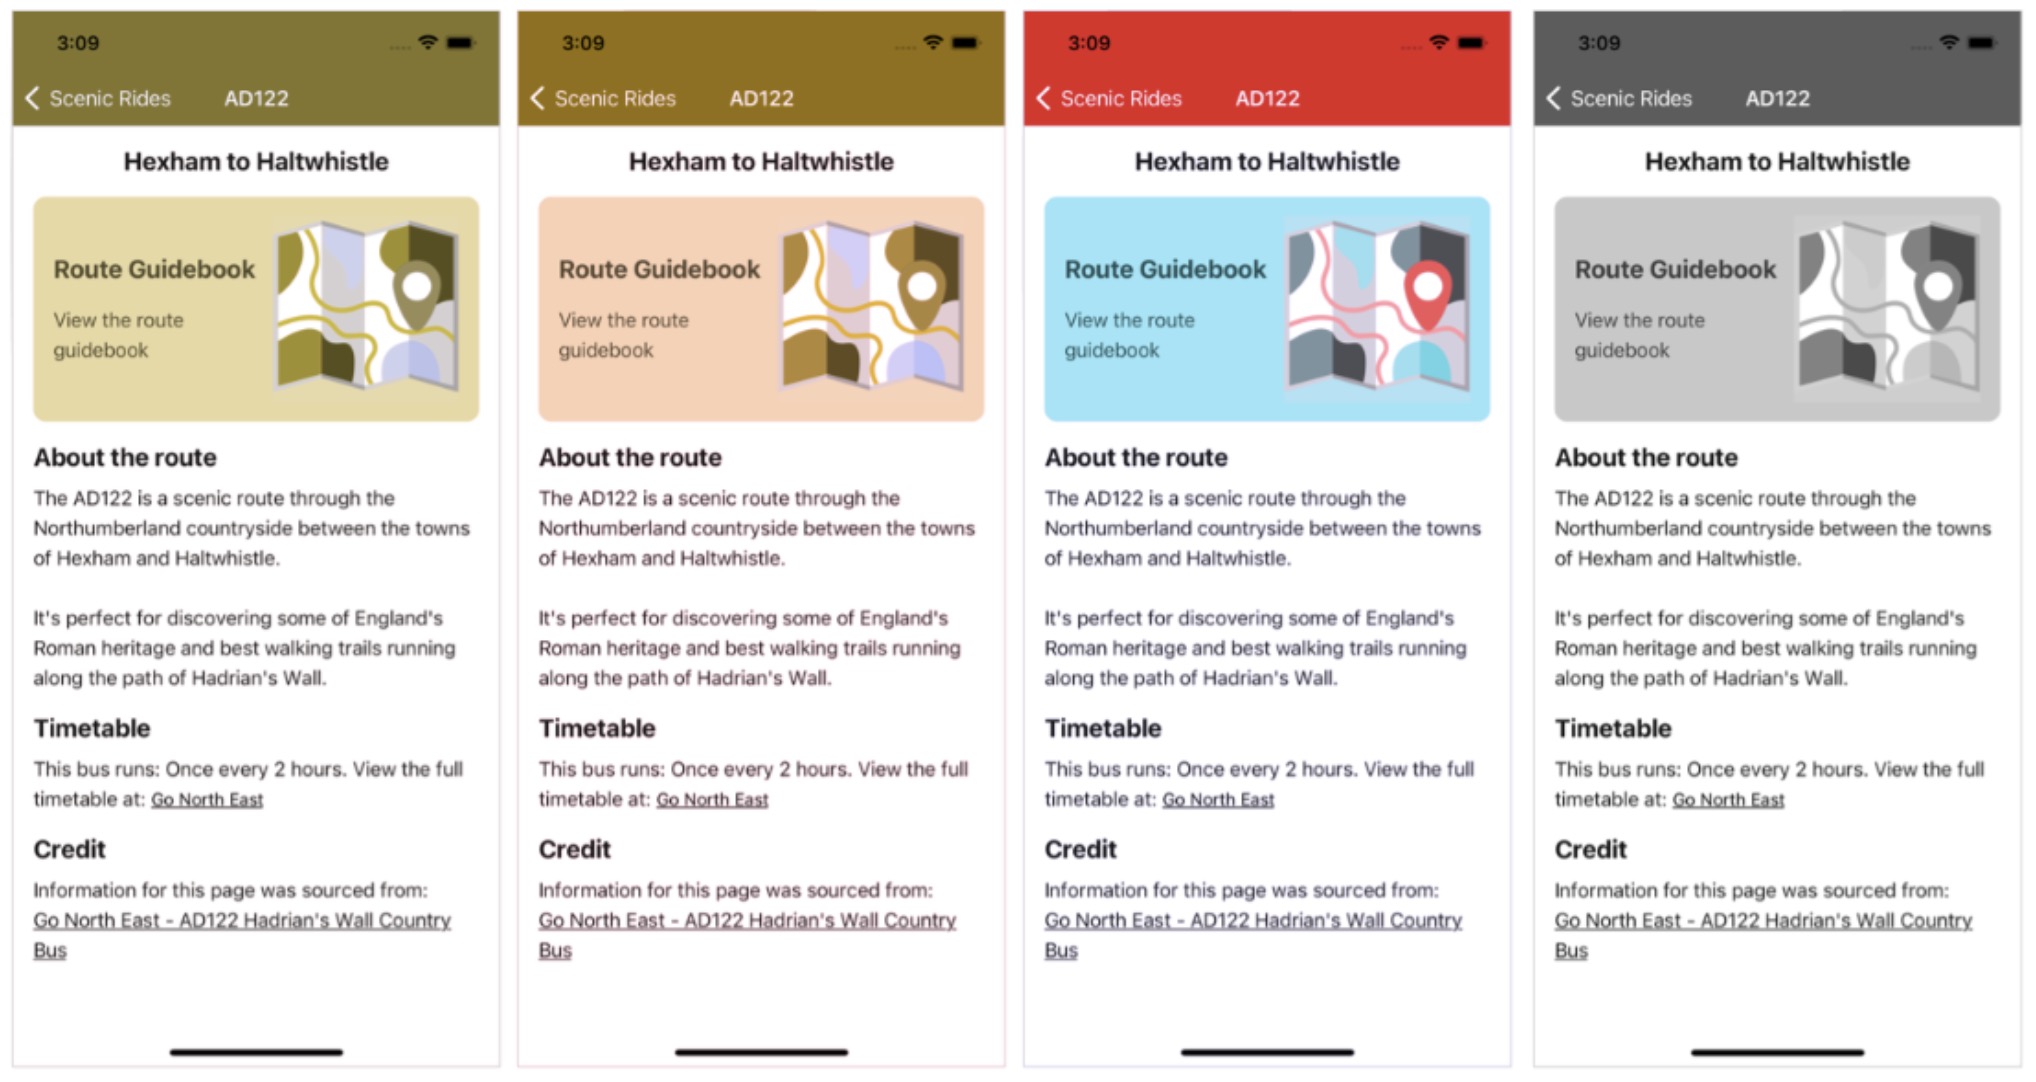
Guidebook Screen
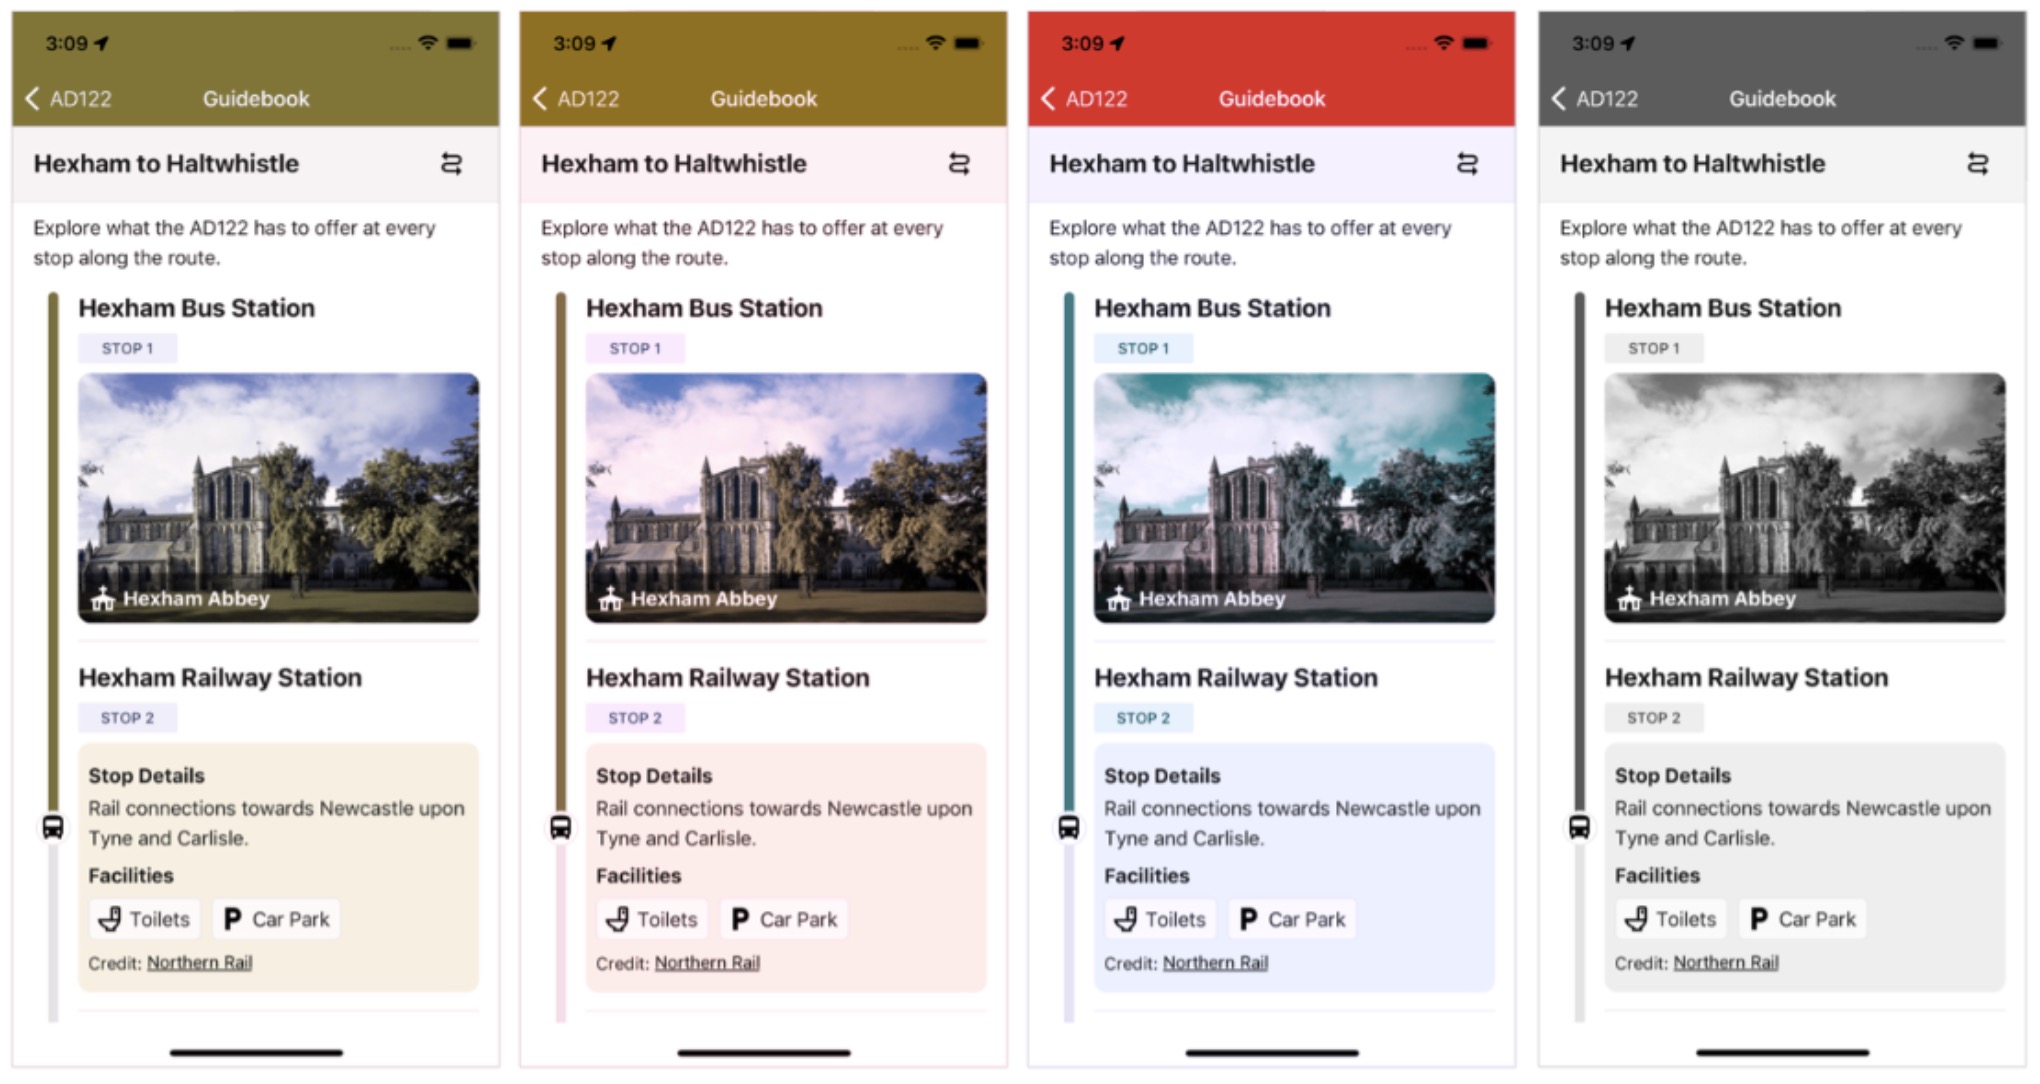
Attraction Screen
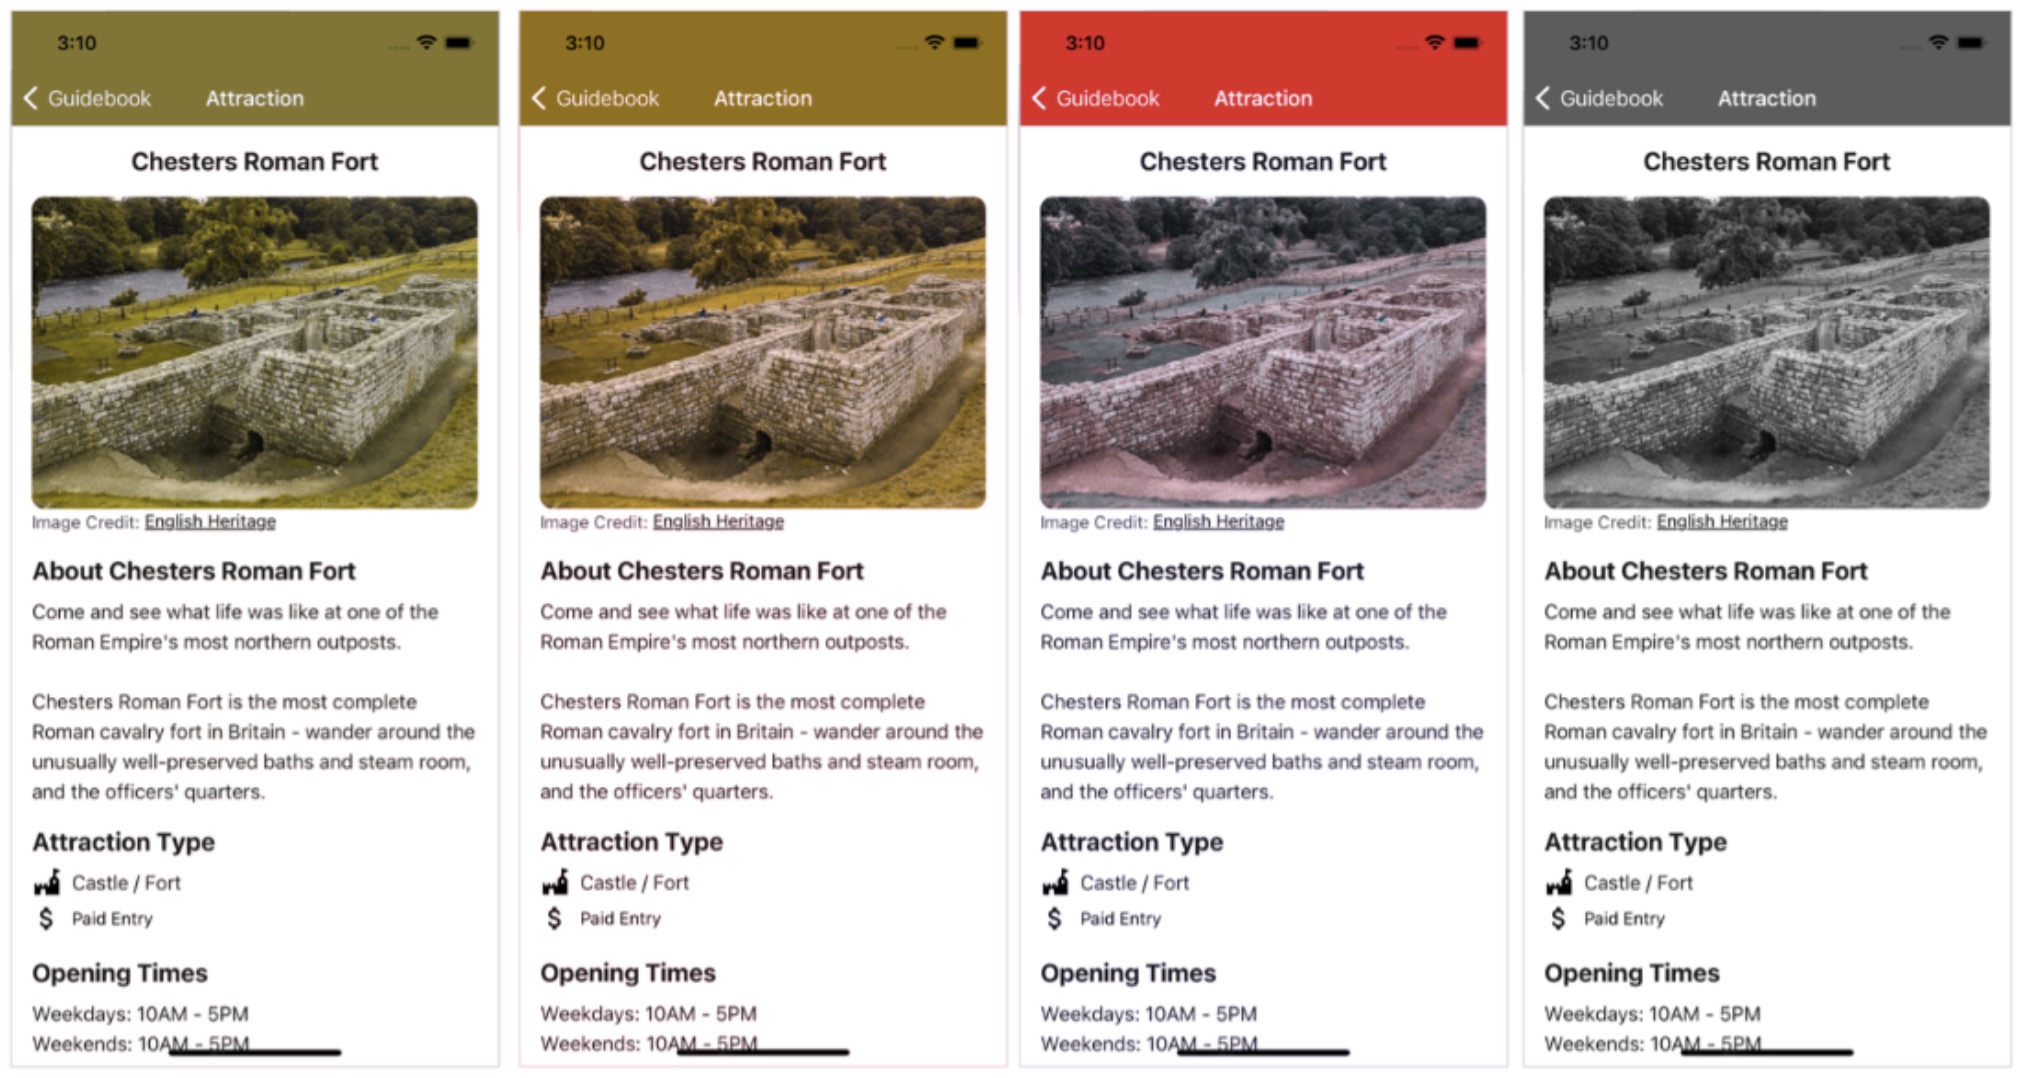
Appendix 5: User Evaluation Guide Sheet
Appendix 5 is a blank copy of the questions given to users as prompts when completing the evaluation of the application and a preface to inform the test users of the evaluation’s purpose.
Preface
- Researcher: Stephen Lunt
- Title of study: A Mobile Guidebook for a Scenic Bus Route
- Information: The purpose of this user evaluation is to gain thoughts and feedback from participants on a mobile application which has been developed to act as a guidebook for a scenic bus route in the North East of England. Specifically, it has been developed for the AD122 route between Hexham and Haltwhistle. Participation in this evaluation will involve using the mobile app on the AD122 route and answering the questions detailed below.
Your participation in this study is voluntary and you can choose to withdraw at any time should you wish. The data collected from this study will be used to aid the evaluation of the mobile application for a dissertation at Newcastle University, its purpose is for academic research only. Any personal data provided will be removed or anonymised.
Questionnaire
- Participants name: __________________
- Date completed: ___/___/___
- What were your initial thoughts and feeling when opening the application for the first time?
- Was the application easy to navigate and understand?
- What features of the application did you find valuable and why? 4. Was the application lacking any features that you think should be included?
- Did you find the application visually appealing?
- Did you encounter any errors, bugs, crashes, or other problems during your interactions with the application?
- Thinking about your time spent using the app during the AD122 ride, do you feel it enhanced your journey today? Why/why not?
- During the trip, when and how did you find yourself using the application?
- Having tested the application, would you use this application again for the AD122 journey or other scenic bus routes if this application was publicly available and why?
- Would you recommend the application to a friend or family member to use?
- Additional comments/feedback.
Appendix 6: User Evaluation Sheet for Participant 1
Appendix 6 contains a typed copy of the completed evaluation sheet from Participant 1.
Questionnaire
- Participants name: Participant 1.
- Date completed: 02/08/2023.
-
What were your initial thoughts and feeling when opening the application for the first time?
- Professional, like the colour scheme and very visual.
-
Was the application easy to navigate and understand?
- Very clear with straight to the point of the aim.
- Links to each section was quick + easy. Some good information, especially with the option of the route guide clearly stating where the route will be taken.
-
What features of the application did you find valuable and why?
- Images of certain key stops which help with envisaging of what’s here. Great clear information of each stop and clear opening/closing times helped plan the day out.
- Liked how the app showed where bus was on route.
-
Was the application lacking any features that you think should be included?
- Maps could be improved to show attraction better in result of bus stops.
-
Did you find the application visually appealing?
- Good use of images + colour scheme as they were inviting.
-
Did you encounter any errors, bugs, crashes, or other problems during your interactions with the application?
- Found that when clicking on an the attraction page was never ending after all information.
-
Thinking about your time spent using the app during the AD122 ride, do you feel it enhanced your journey today? Why/why not?
- Helped plan journey better as it shows what is exactly at each stop and what we can do there.
-
During the trip, when and how did you find yourself using the application?
- It was good prior to the trip however mostly used mid-way as the bus was in motion.
-
Having tested the application, would you use this application again for the AD122 journey or other scenic bus routes if this application was publicly available and why?
- Yes, I would use this app again as its simple to use and navigate as well as being very user friendly.
-
Would you recommend the application to a friend or family member to use?
- Yes!
-
Additional comments/feedback.
- Great app and very informative.
Appendix 7: User Evaluation Sheet for Participant 2
Appendix 7 contains a typed copy of the completed evaluation sheet from Participant 2.
Questionnaire
- Participants name: Participant 2.
- Date completed: 02/08/2023.
-
What were your initial thoughts and feeling when opening the application for the first time?
- Simple (not in a bad way) and easy to use/understand what the app does.
-
Was the application easy to navigate and understand?
- Yes, navigation was easy as there are not many links to click, it was quite intuitive to use.
-
What features of the application did you find valuable and why?
- The tracking screen was good to see where I was on the bus. Without it I wouldn’t really understand where I was and what was around me without using a map. Information on attractions also good, means I don’t need to search the web which can be time consuming.
-
Was the application lacking any features that you think should be included?
- More variety of attractions and stop info. Walking trails should be included considering the route. A map that can be interacted with would be nice, the current ones are too small to make sense of.
-
Did you find the application visually appealing?
- Yes, colours where bold and bright. Things like the tracker with the bus icon looked quite unique.
-
Did you encounter any errors, bugs, crashes, or other problems during your interactions with the application?
- Between The Sill and Vindolanda the tracker jumped between the two stops?
-
Thinking about your time spent using the app during the AD122 ride, do you feel it enhanced your journey today? Why/why not?
- Yes, made it simpler to have an app which contained everything in one place. Otherwise, it would be a hassle to find every attraction I wanted to visit.
-
During the trip, when and how did you find yourself using the application?
- Used it to follow along with the bus and view info on attractions.
-
Having tested the application, would you use this application again for the AD122 journey or other scenic bus routes if this application was publicly available and why?
- Yes, however more routes and more variety of attractions would make it better.
-
Would you recommend the application to a friend or family member to use?
- Yes, I could see people I know liking this.
-
Additional comments/feedback.
- No.
Appendix 8: Incident Report from the User Evaluation
Appendix 8 is an incident report detailing a bug in the application discovered during user testing.
- When: Between Vindolanda and The Sill.
- Who: Participant 2.
- Details: On the section of route between The Sill, Vindolanda, and returning to The Sill the progress bar within the application appeared to jump between stops.
- Severity: Medium. This incident only affects sections of the route where the bus loops back on itself on the same road.
- Investigation details: On investigation of the incident reported, it appears the bug was caused by the
calculateRouteProgressfunction failing to determine the correct nearest point to the user. This applies only on sections of route where the bus loops back on itself (i.e., it travels on the same road previously travelled on). This is illustrated in the graphic included below showing a scenario where the bus leaves Vindolanda. The red arrow illustrates the direction of travel of the bus (star icon). Blue dots above the road represent coordinate points on approaching route, whereas blue dots below the road are point for the departing route. The application could wrongly determine an approaching point (e.g., point A) to be closest instead of a departing one (e.g., point B), resulting in the progress bar jumping between stops.
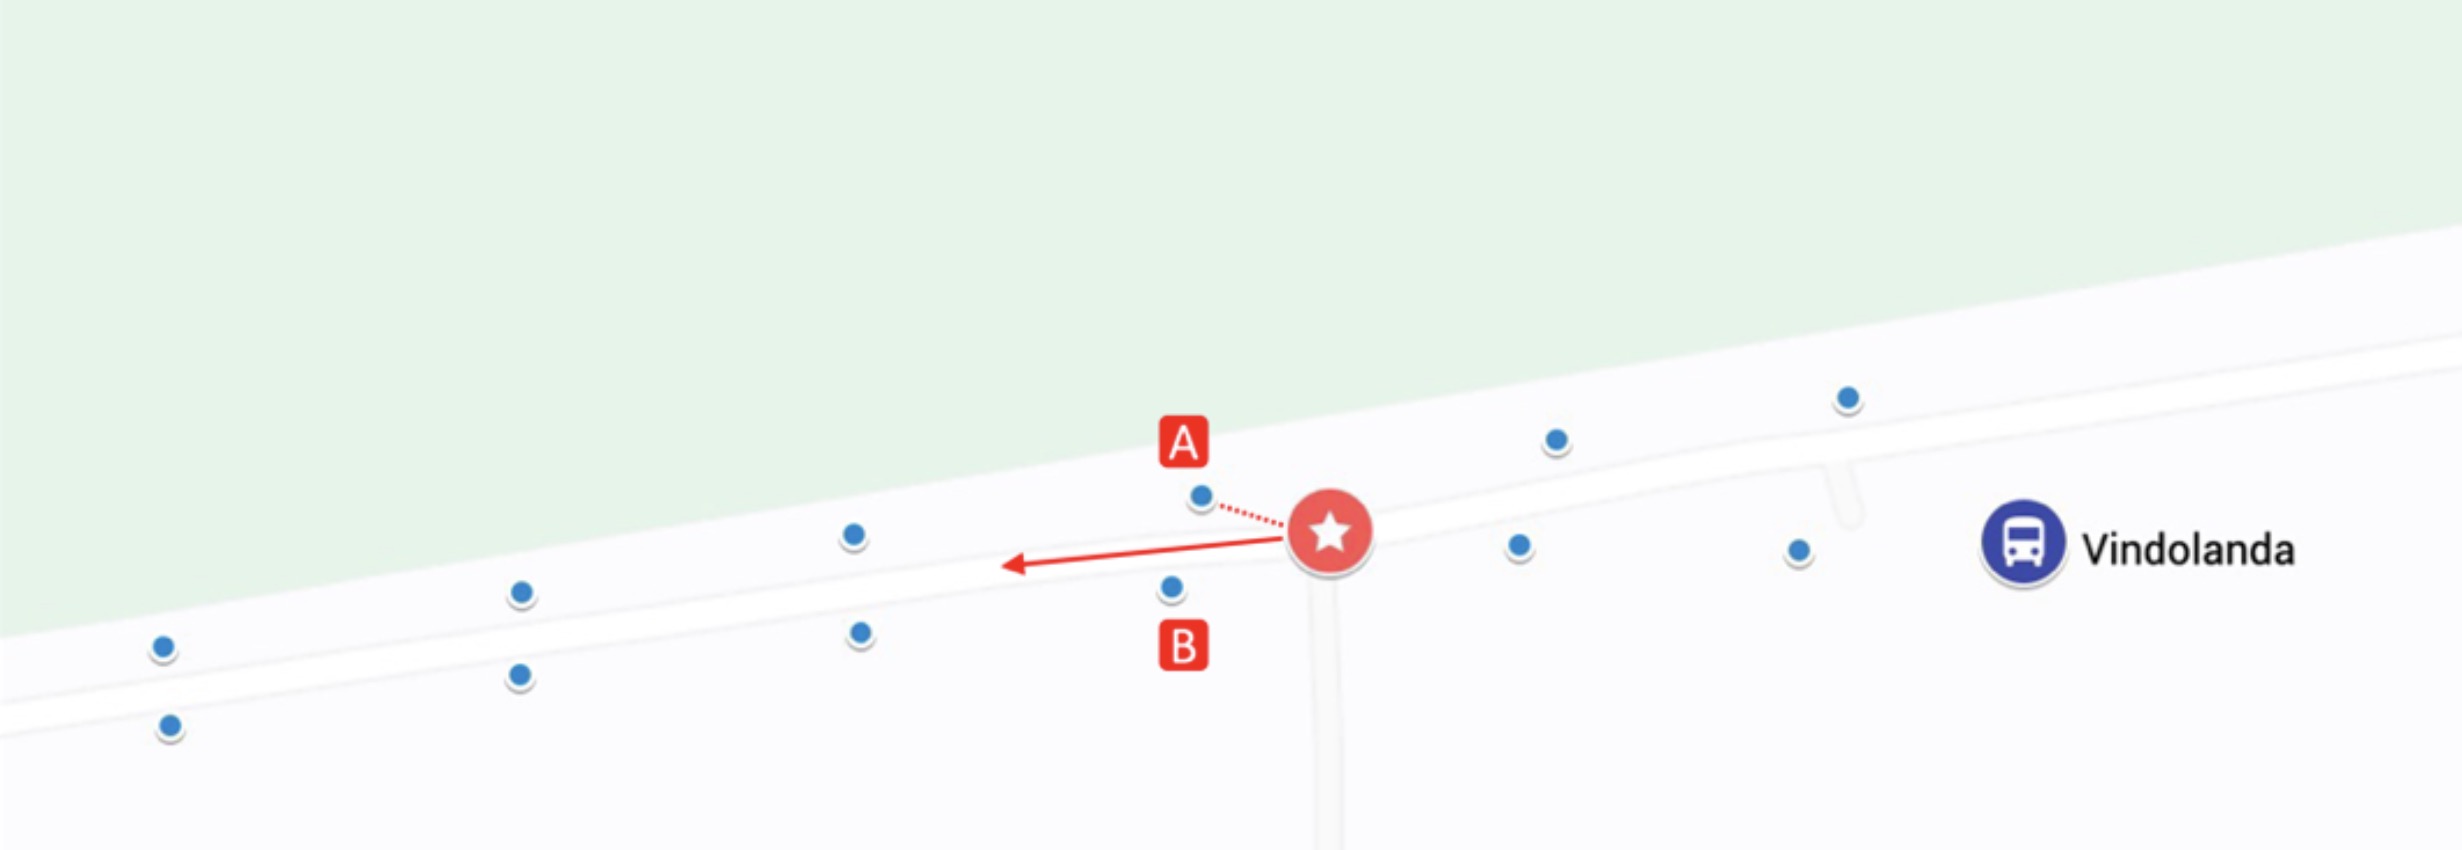
- Recommended action: A fix should be put in place for the next version of the application which resolves this bug. The work will involve thinking about the logic of the
calculateRouteProgressfunction for sections which loop back. Initial ideas include using the heading value obtained from the geolocation object to ensure the nearest points and next stop factor this into the calculation.